
Announcement: Trade Alerts
Consistent setups. Clear levels. Real positioning.


Since starting this newsletter, my ambition was never to provide you with just another forecast on the current trading landscape.
Sure, it’s important to recognize the environment we’re in.
But what matters more is how we navigate our portfolios inside that environment as conditions evolve in real time.
Because despite all the noise, baseless predictions and speculation, markets don’t reward spectators. They reward decision-makers.
And over the last few months I’ve realised something:
If I’m already doing the work…
tracking leadership…
watching breadth…
monitoring credit…
building trade theses…
then there’s no reason you shouldn’t be able to look over my shoulder while I do it.
So from here on, I’m going to start sharing trade alerts and positioning updates directly through Substack.
Not predictive paths or wild speculation - just actionable charts offering solid risk/reward for those that want them.
My Ideal Setup
No two traders are the same and everybody has their preferred setups.
For me, I try to keep things as simple as possible.
When adding long positions, whether calls, commons etc., then I want to see the following criteria met:
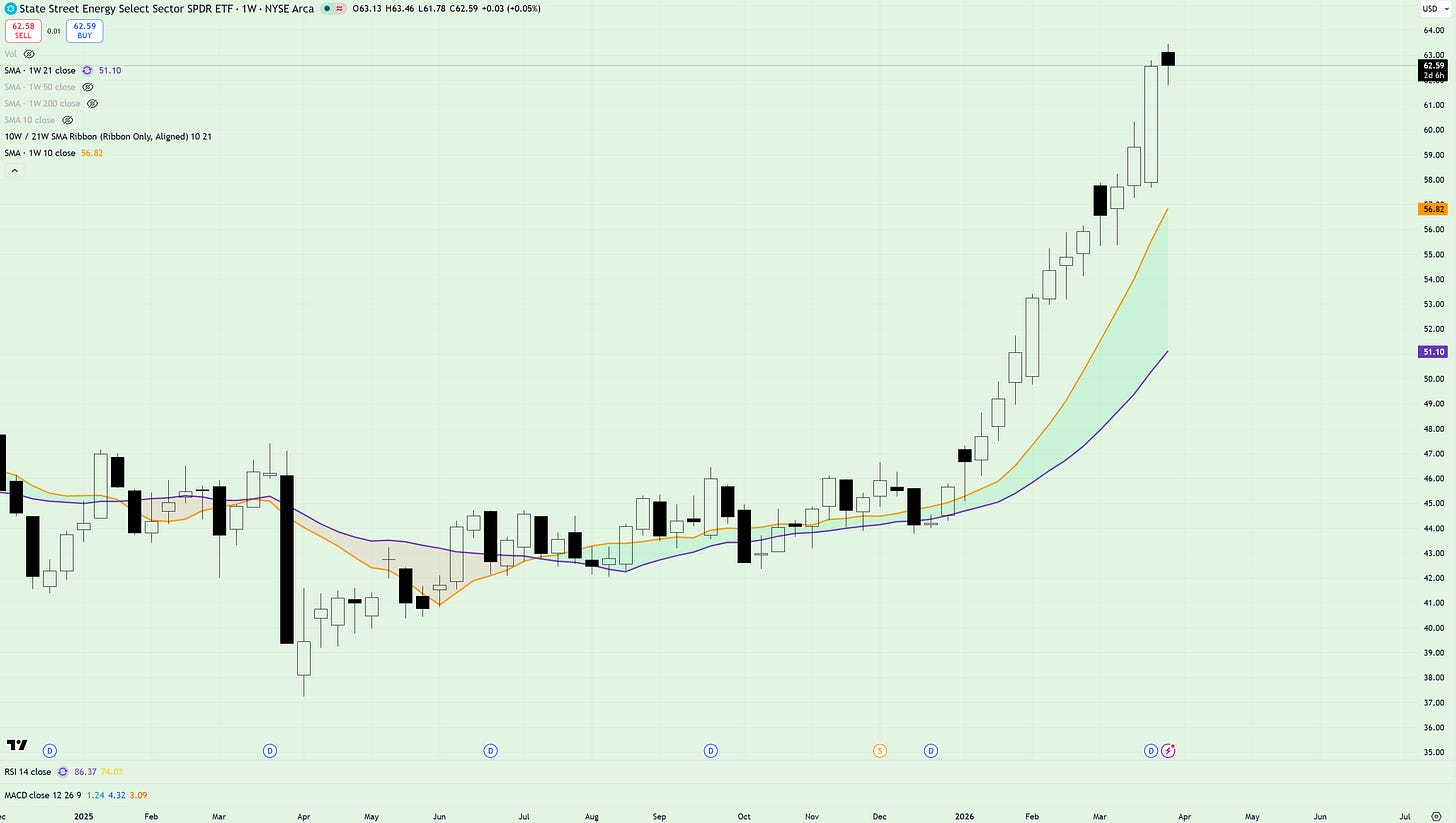
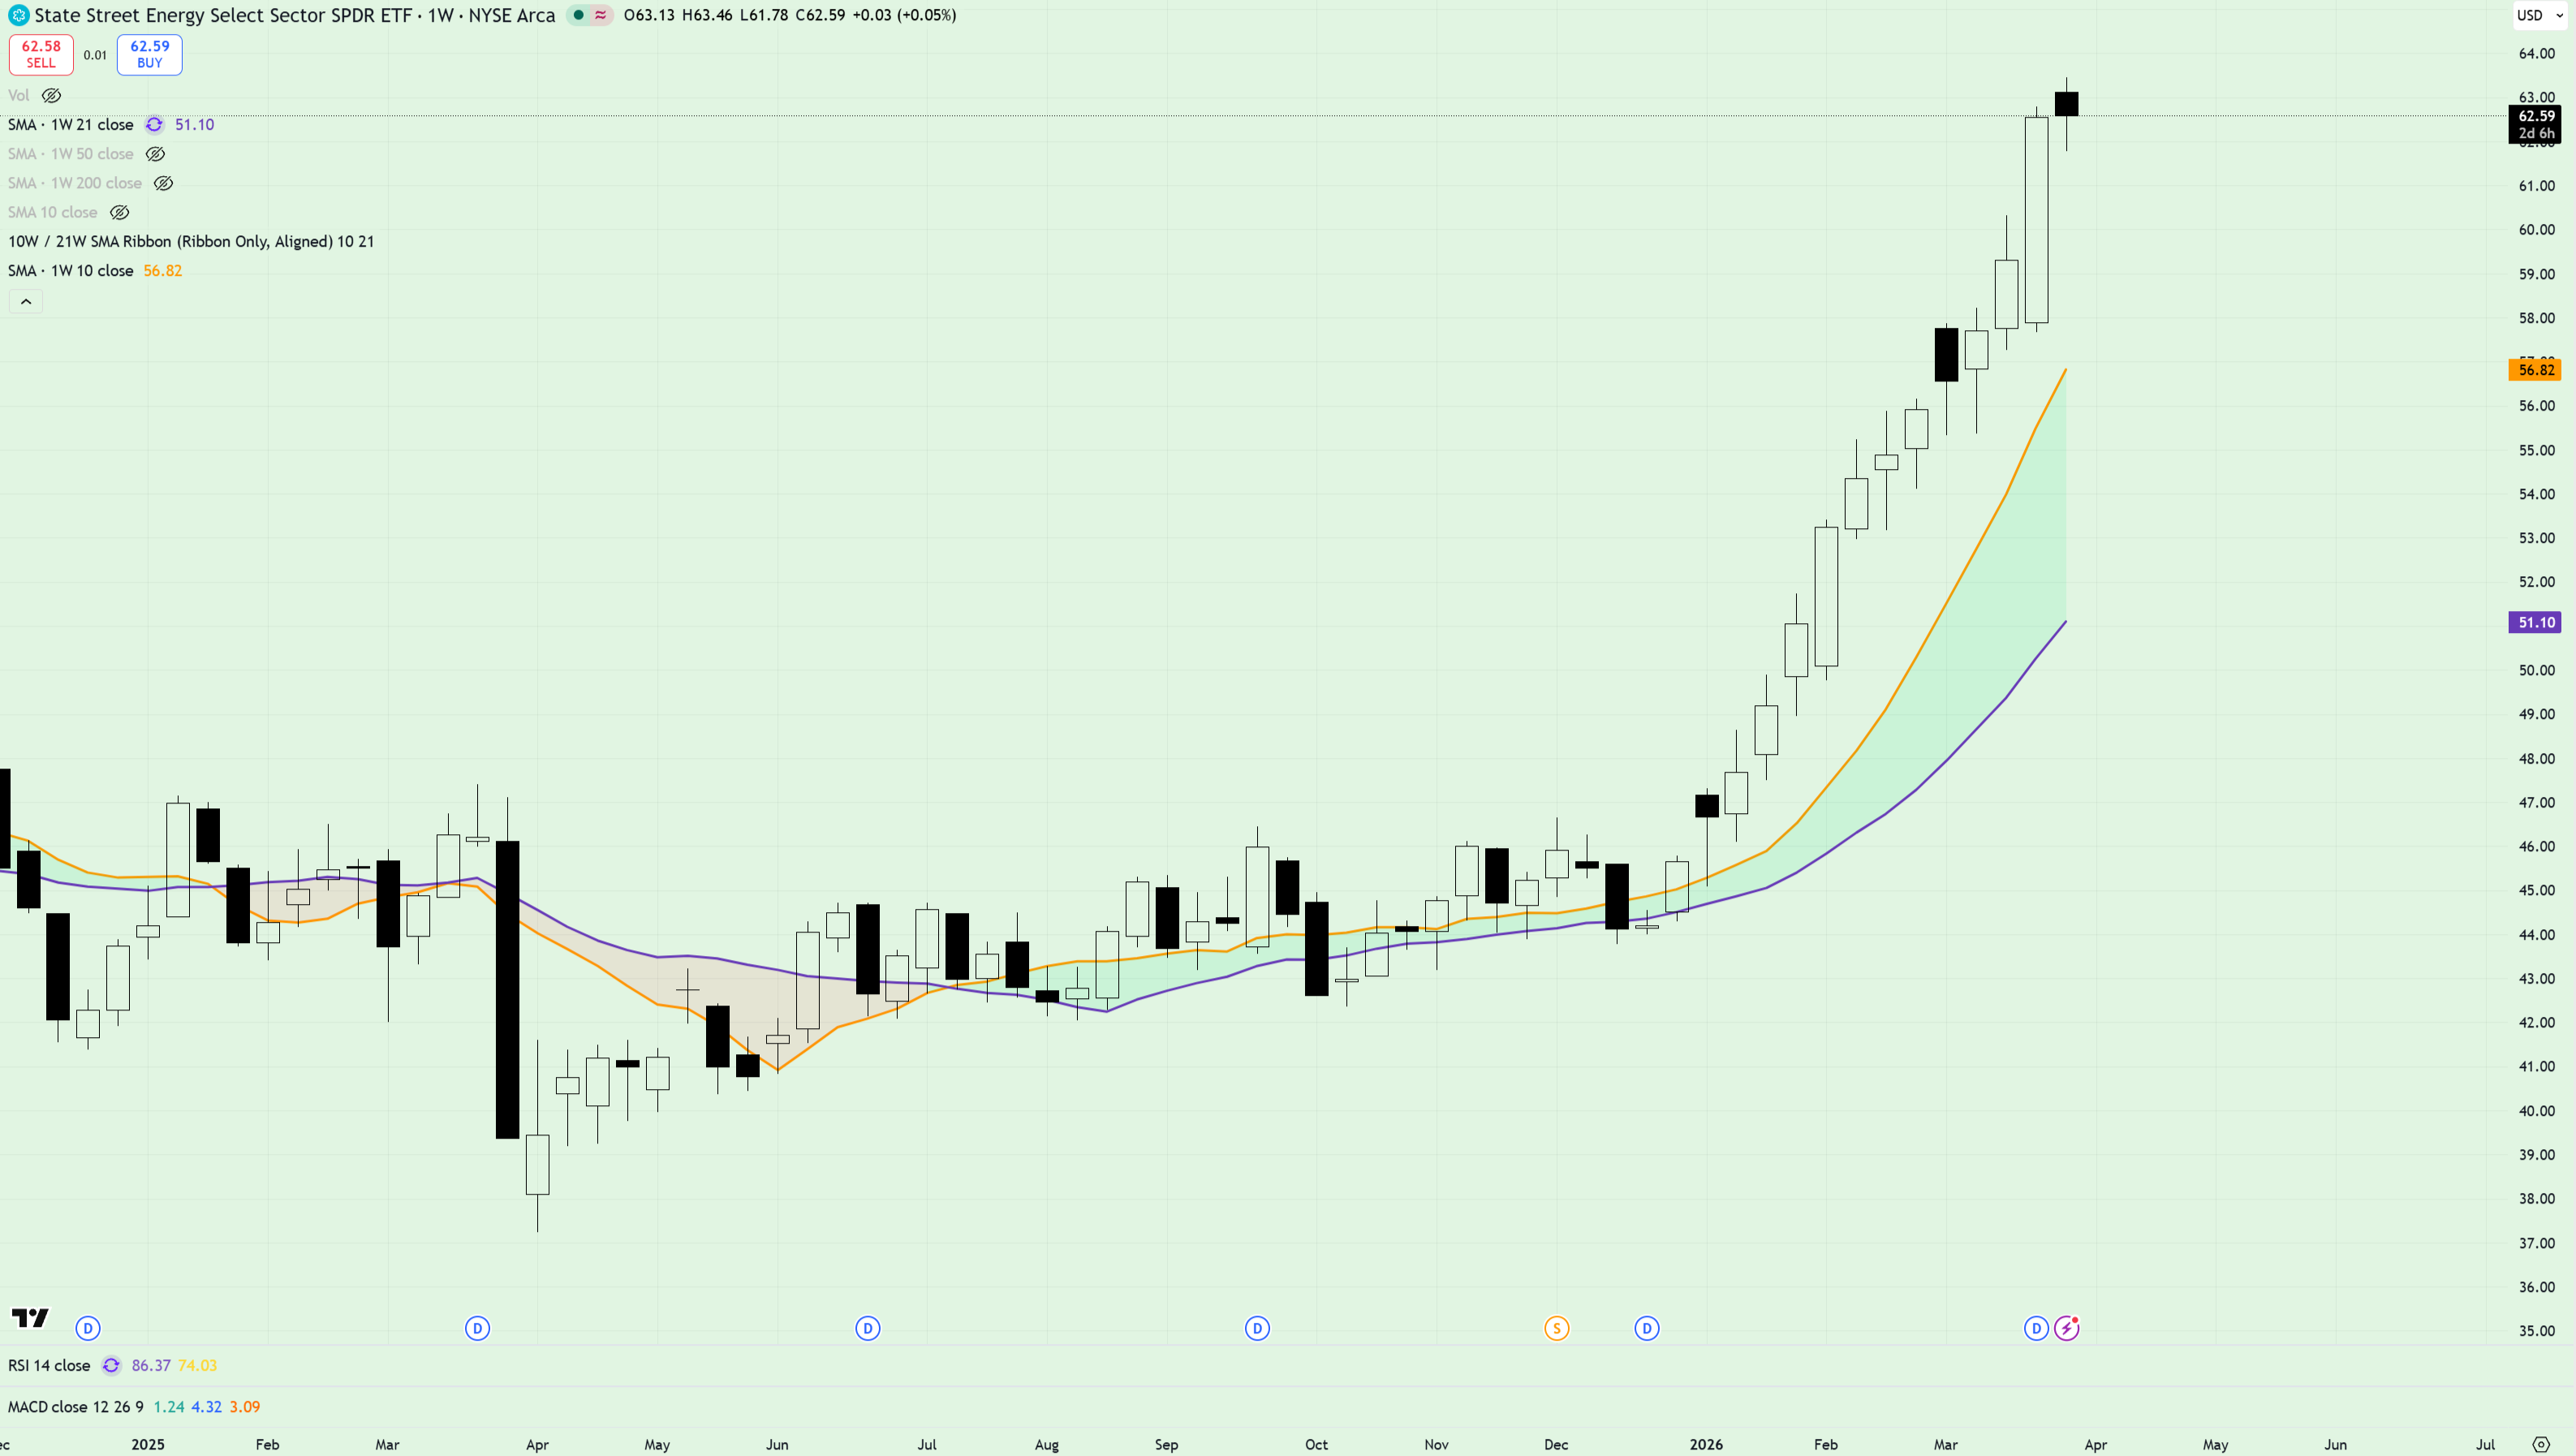
The stock must be showing continued strength within an uptrend. How do I determine what’s in an uptrend? On the weekly chart I want to see the 10wma upwardly mobile above the 21wma. As an example, take note of XLE:
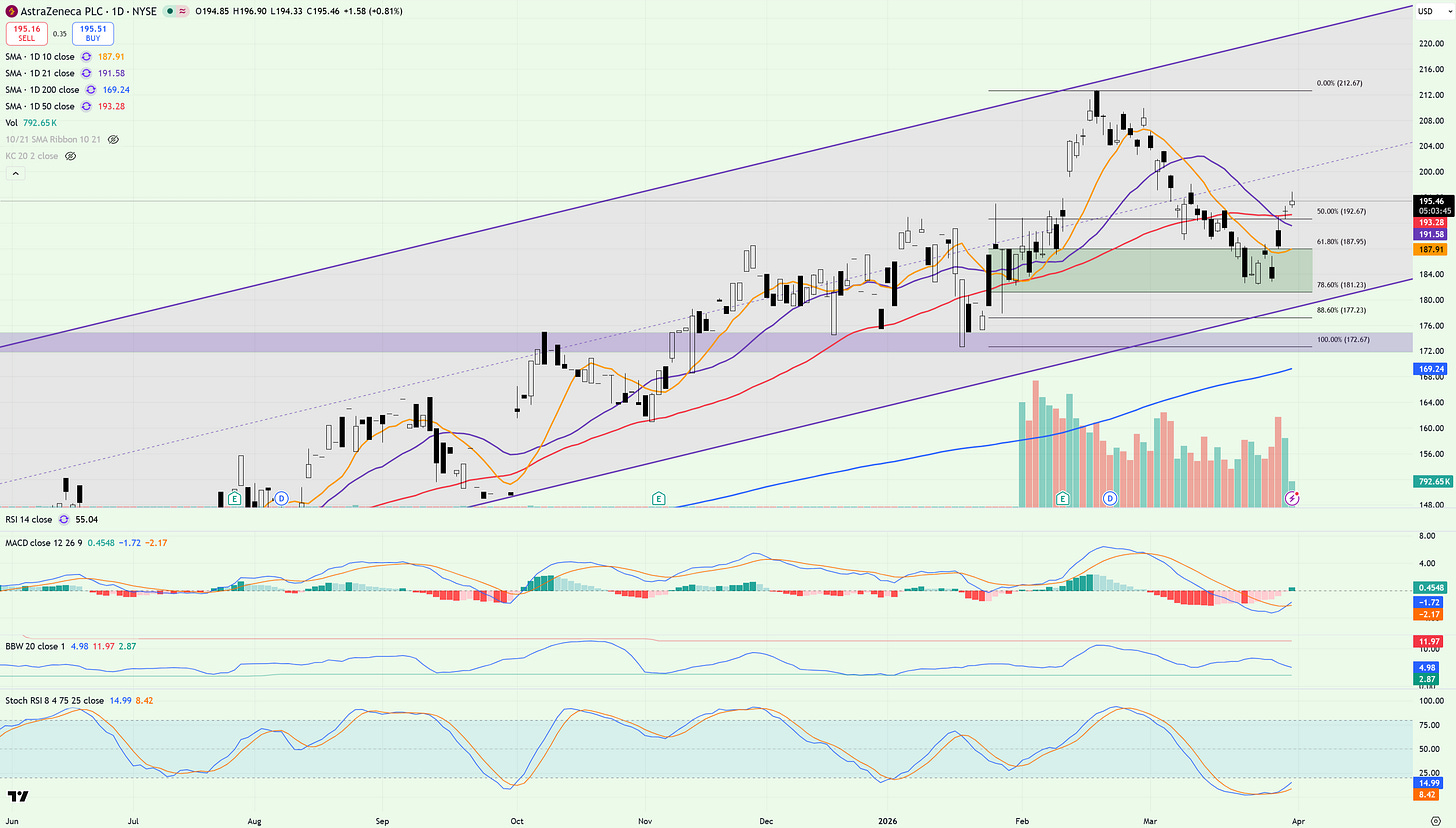
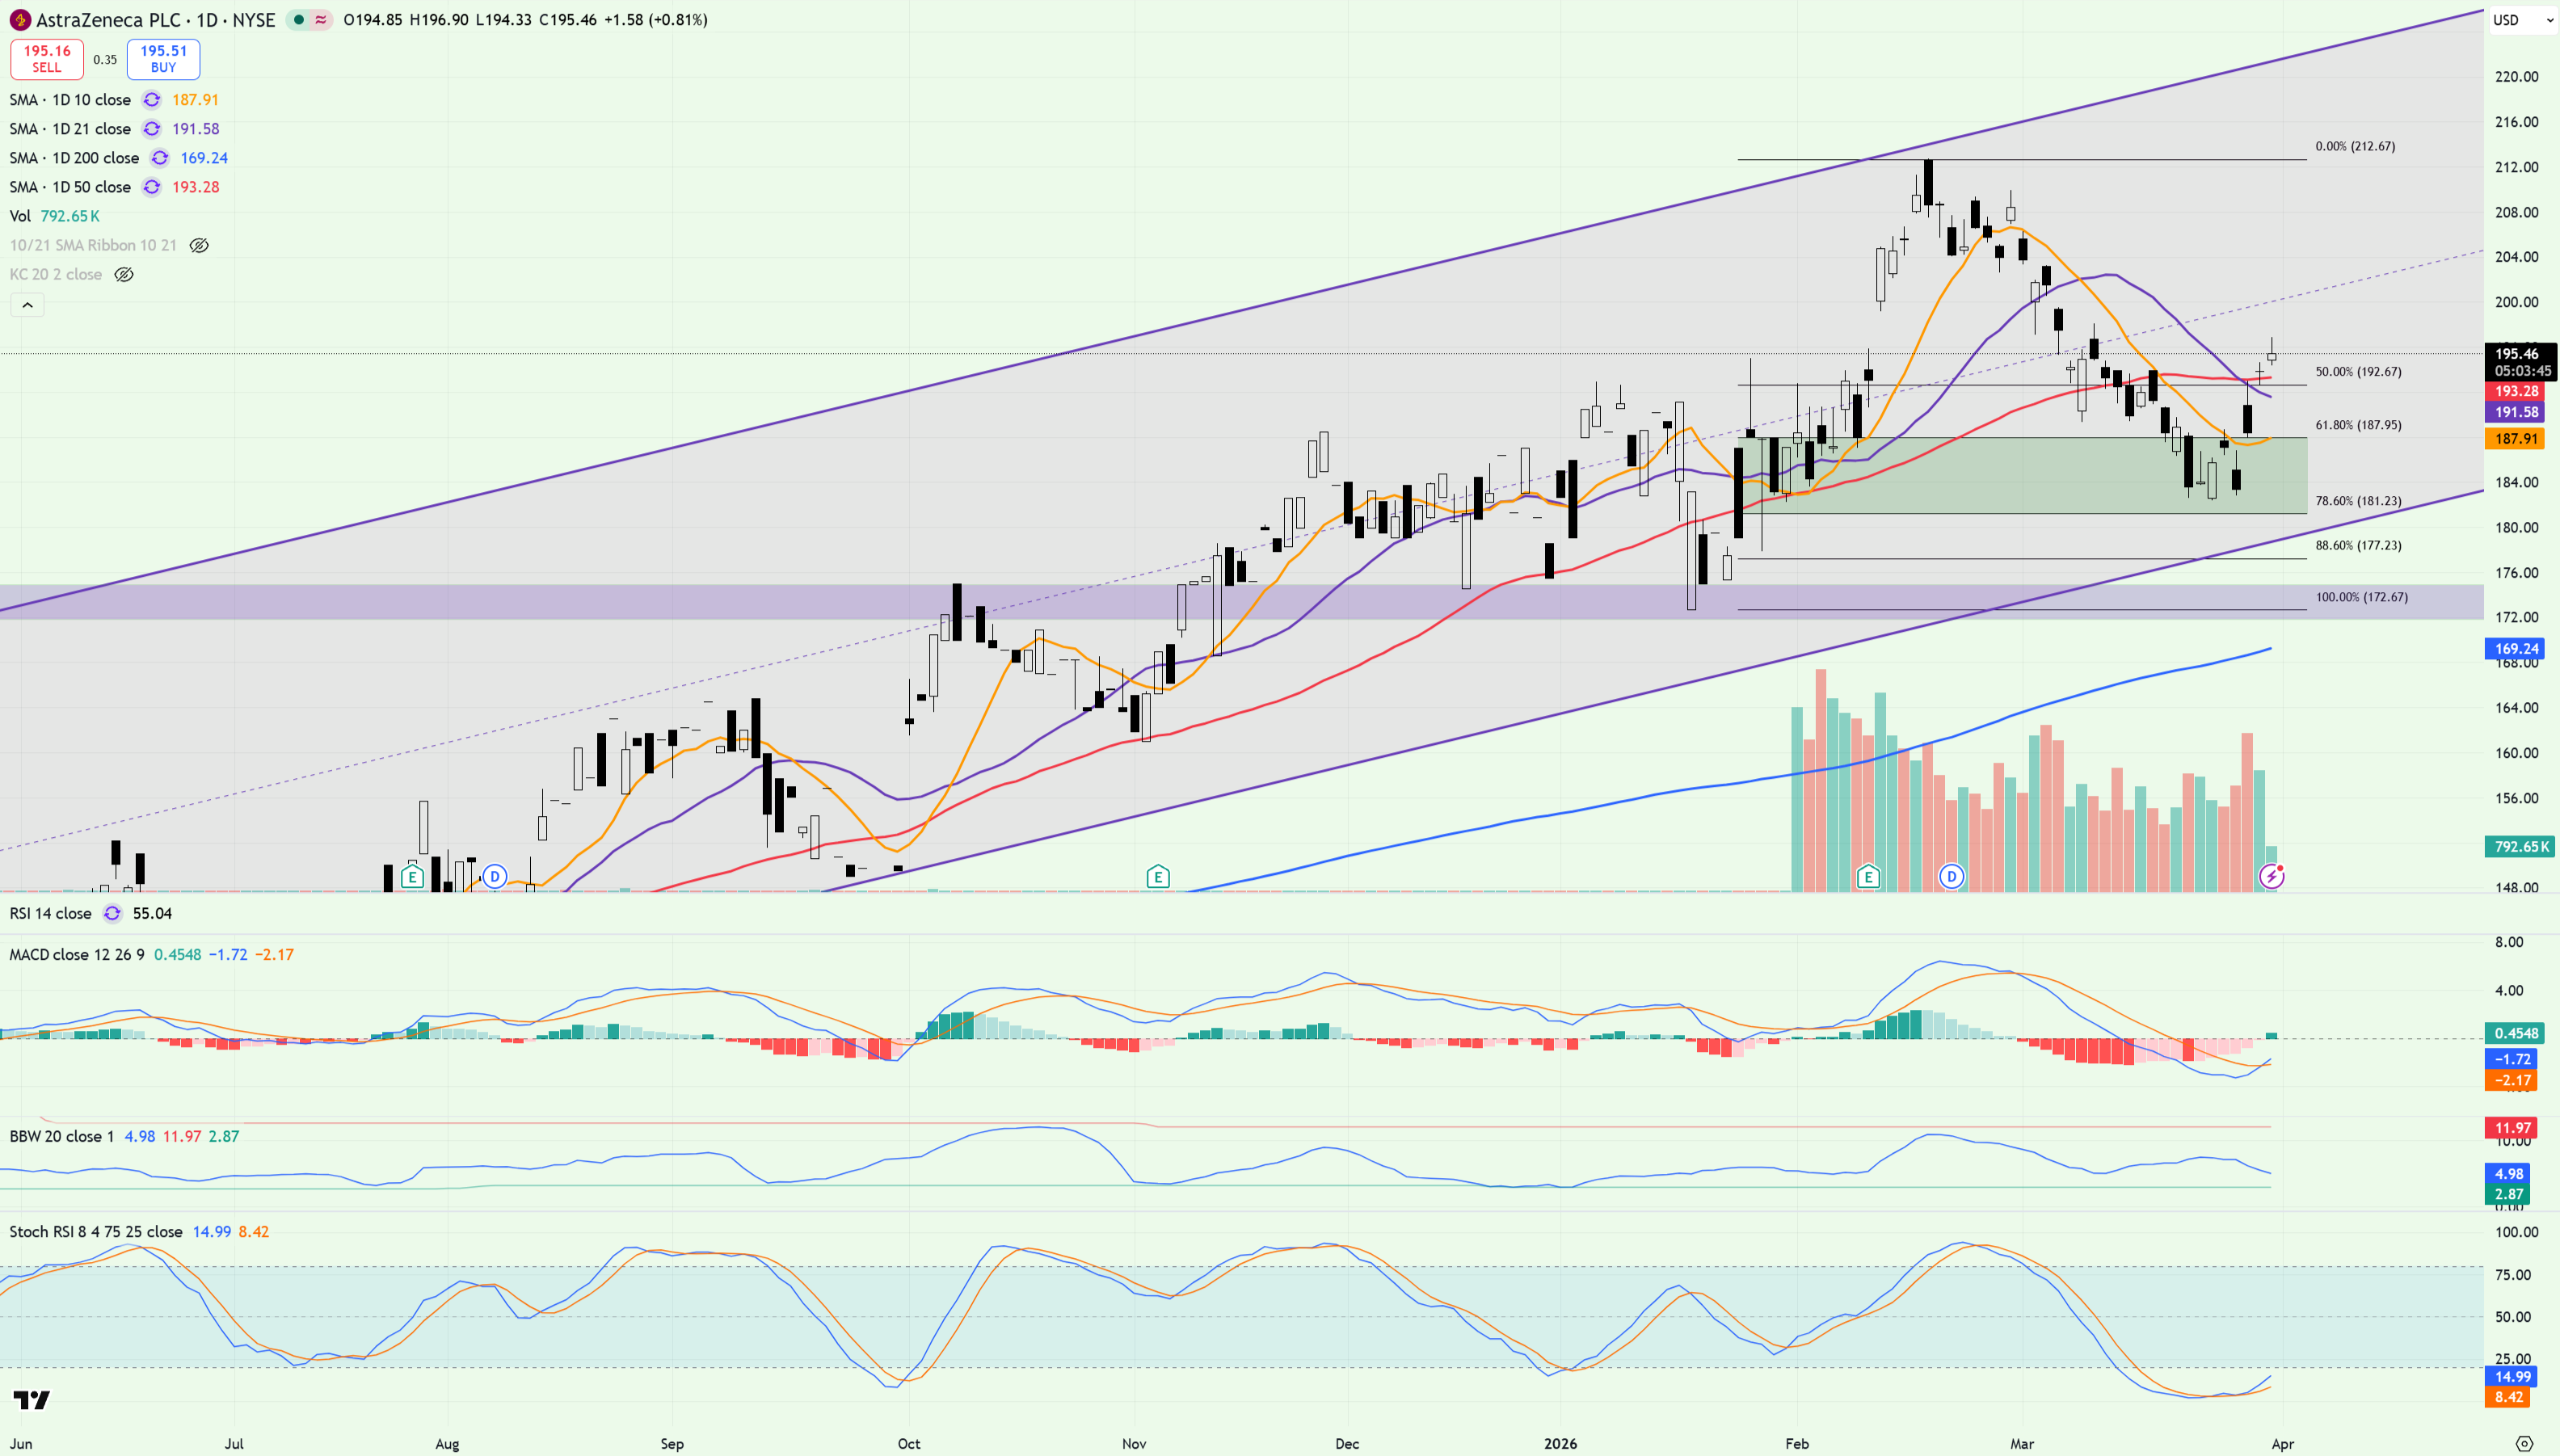
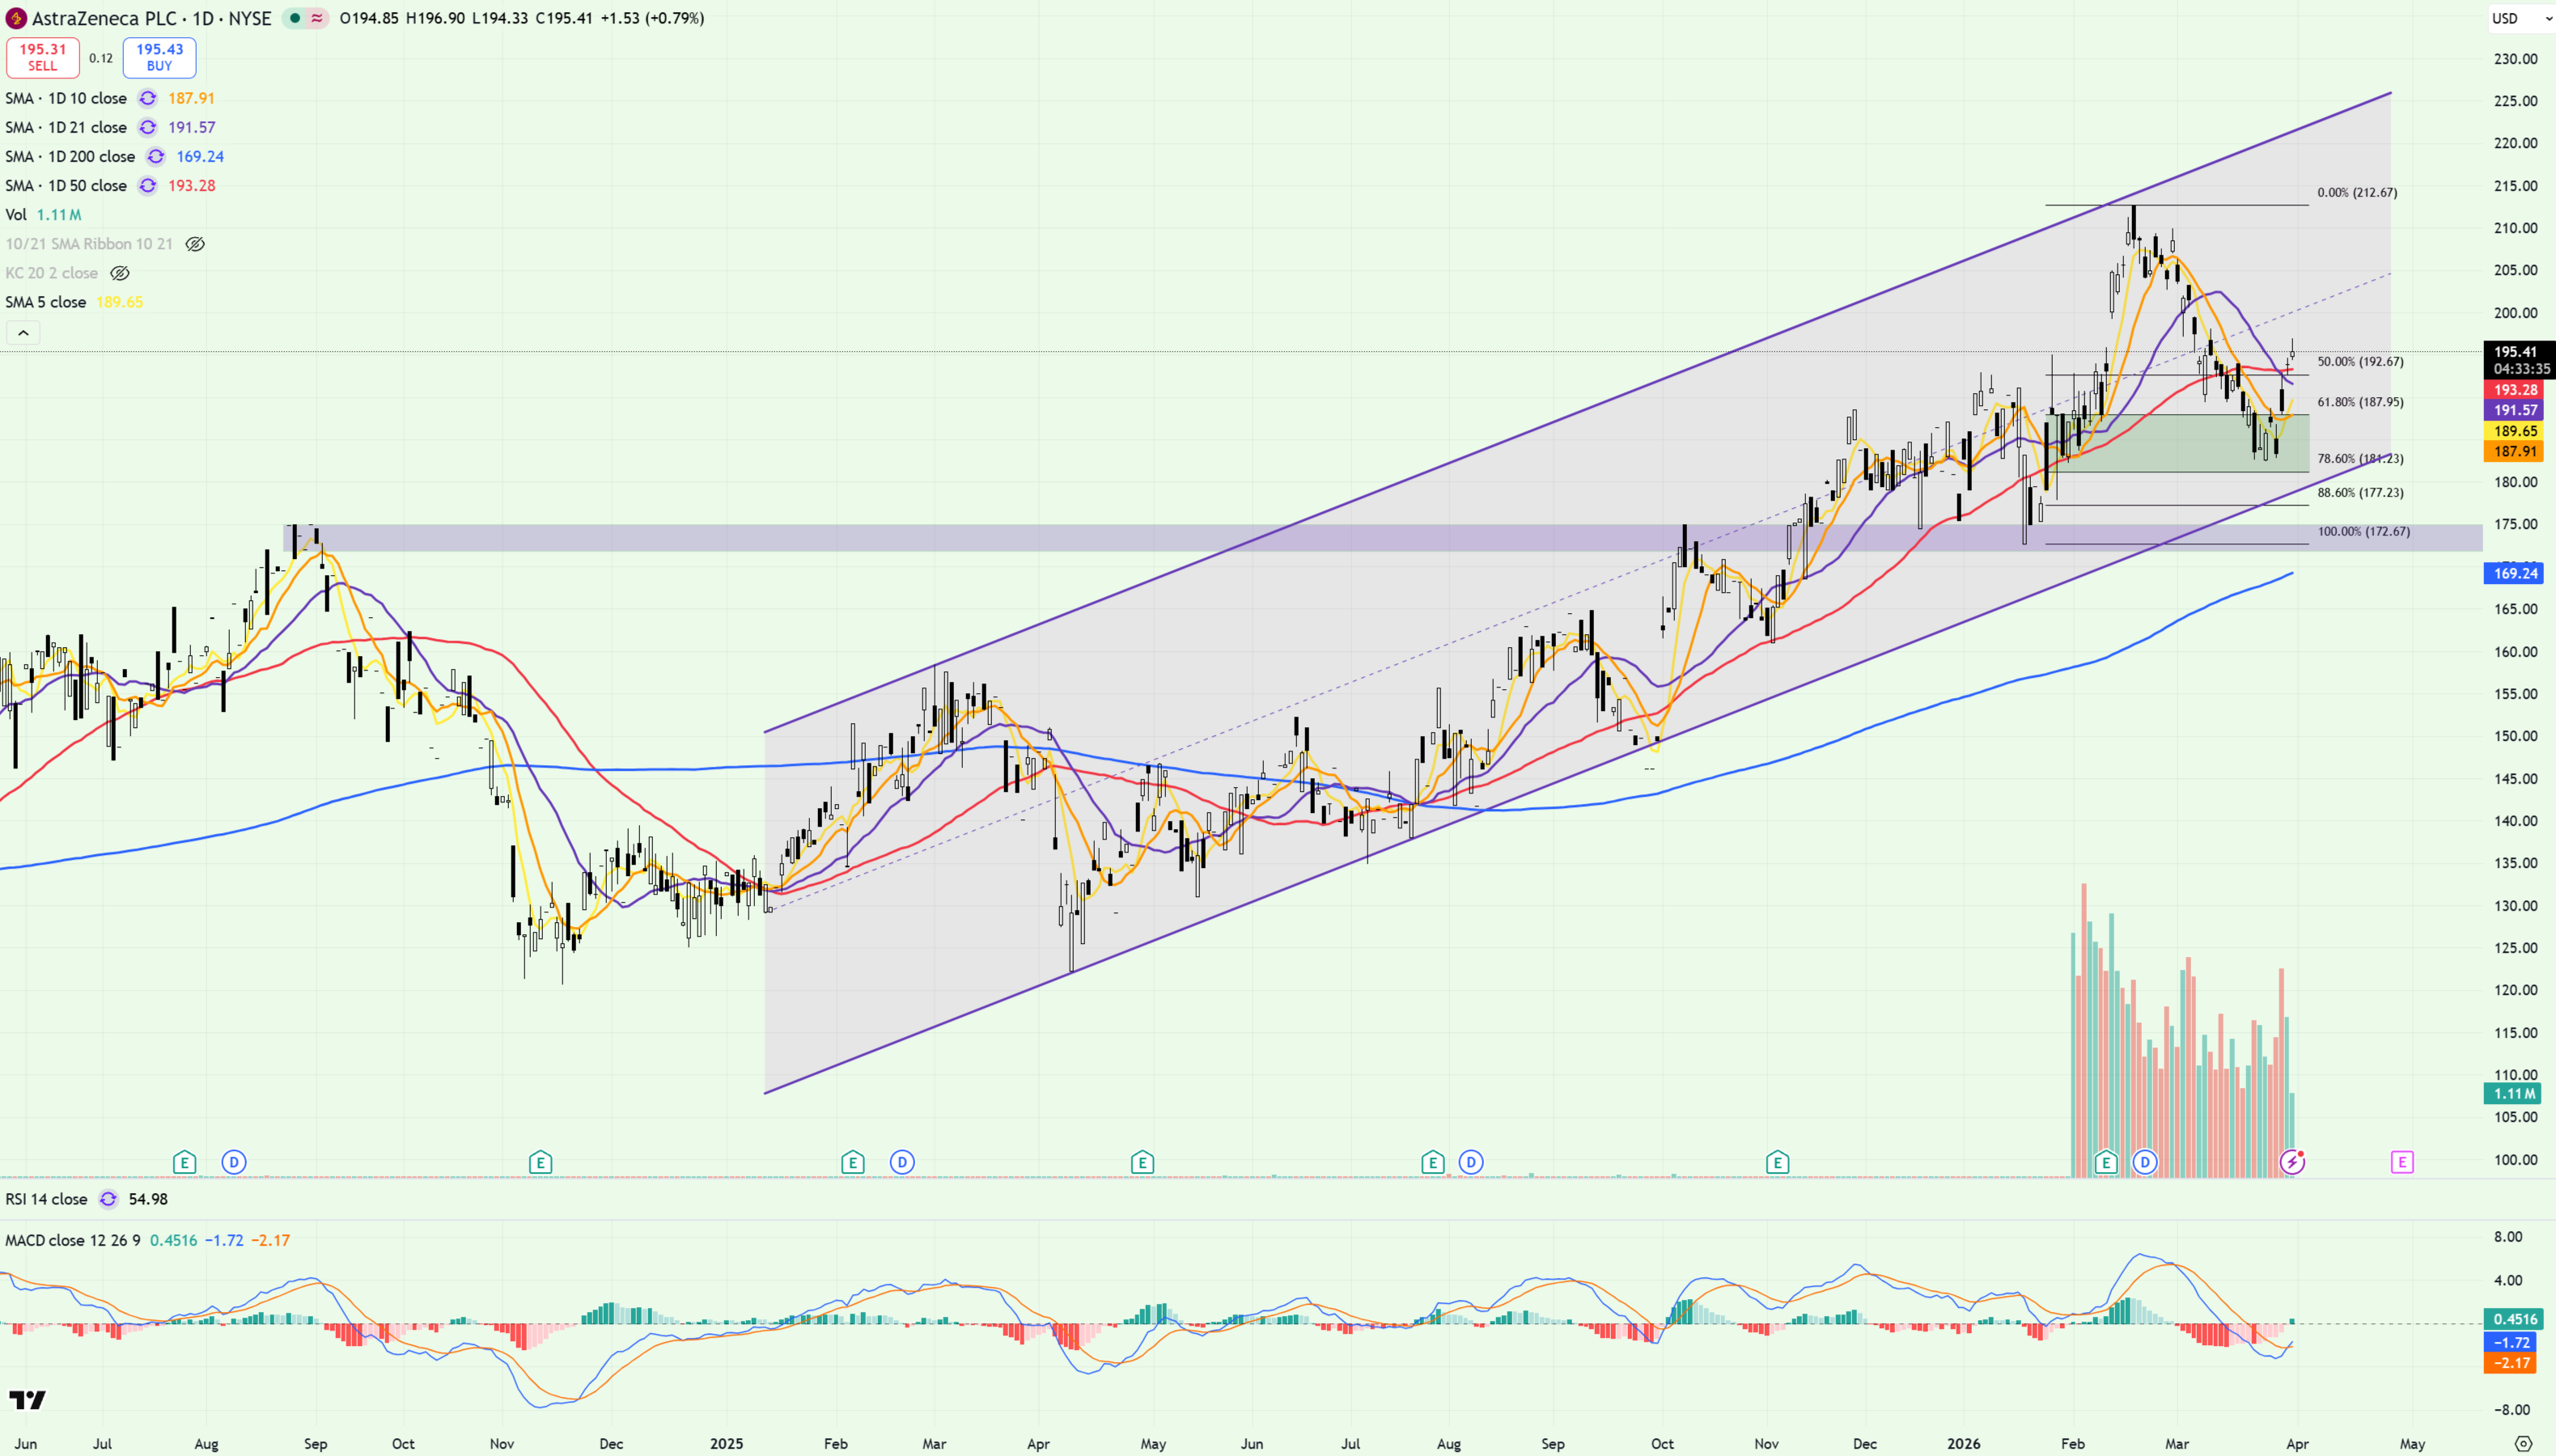
Next, I like to see a retracement within said uptrend. For that I switch to the daily chart, relying on Fibonacci levels to determine where a decent entry might be. As an example, here’s a recent trade a took on AZN - note the trend of higher lows and higher highs and the retracement down to the ‘golden pocket’ on the prior swing low.
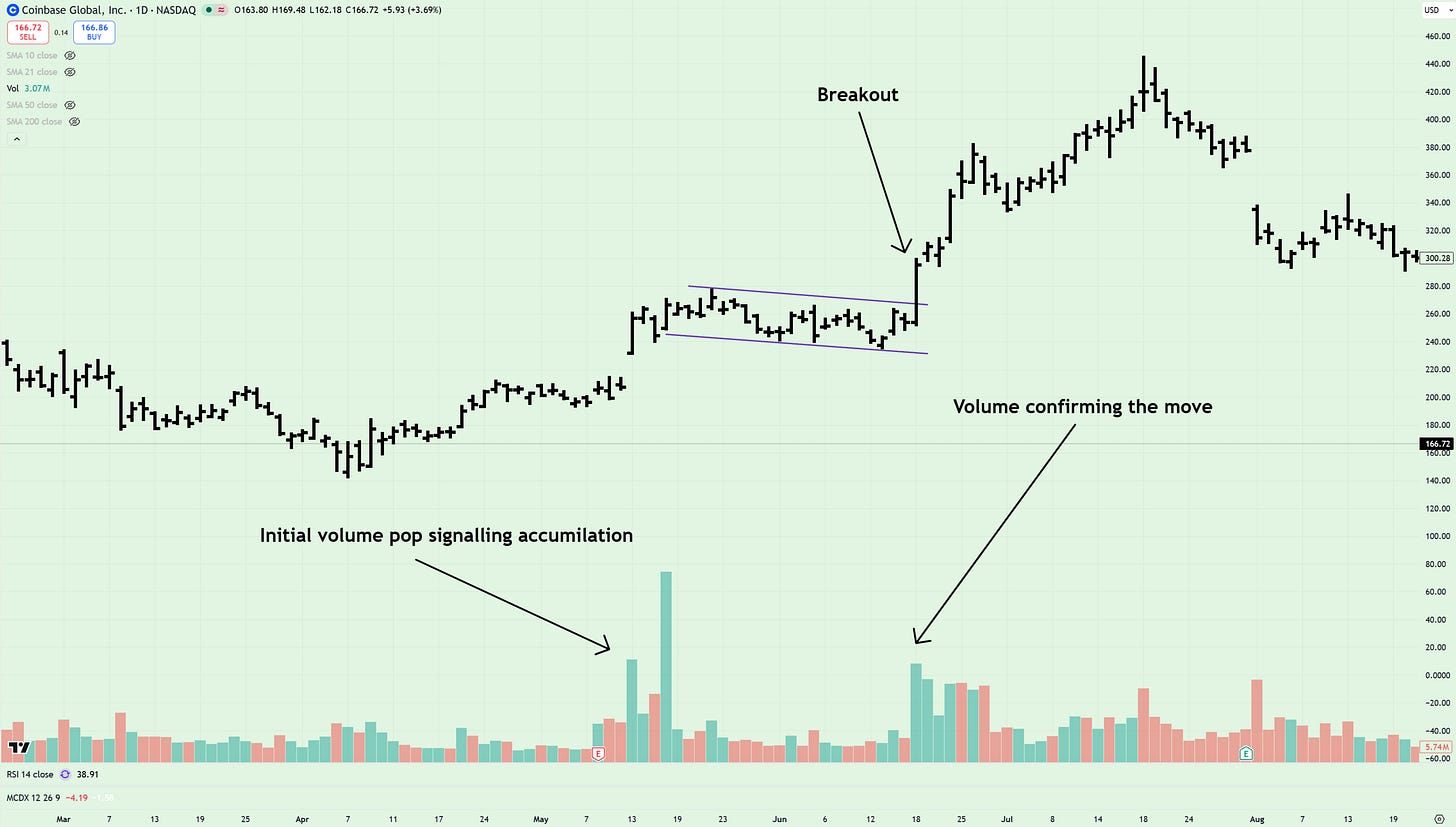
Volume is a key indicator too - as it typically shows where/when big money is entering/exiting a position. Take note of the example below from COIN back in May 2025. I’ve annotated the chart to help explain what played out.
Last of all, I want to see full timeframe confluence. This is the secret sauce that a lot of traders miss. In its simplest form, it means asking one question: Are the different timeframes telling the same story?
Markets are fractal. The same patterns repeat across quarterly, monthly, weekly and daily charts just at different speeds and with different consequences.
That’s where The Strat becomes so useful. It gives us a structured way to read whether price is expanding, contracting, reversing or continuing across those timeframes.
So before entering a trade, I ask myself: is price trading above/below the prior month’s high/low? How about the weekly? And then finally, the daily. In my view, the ideal retracements are those that hold above the weekly and monthly - but it all depends on your timeframe.
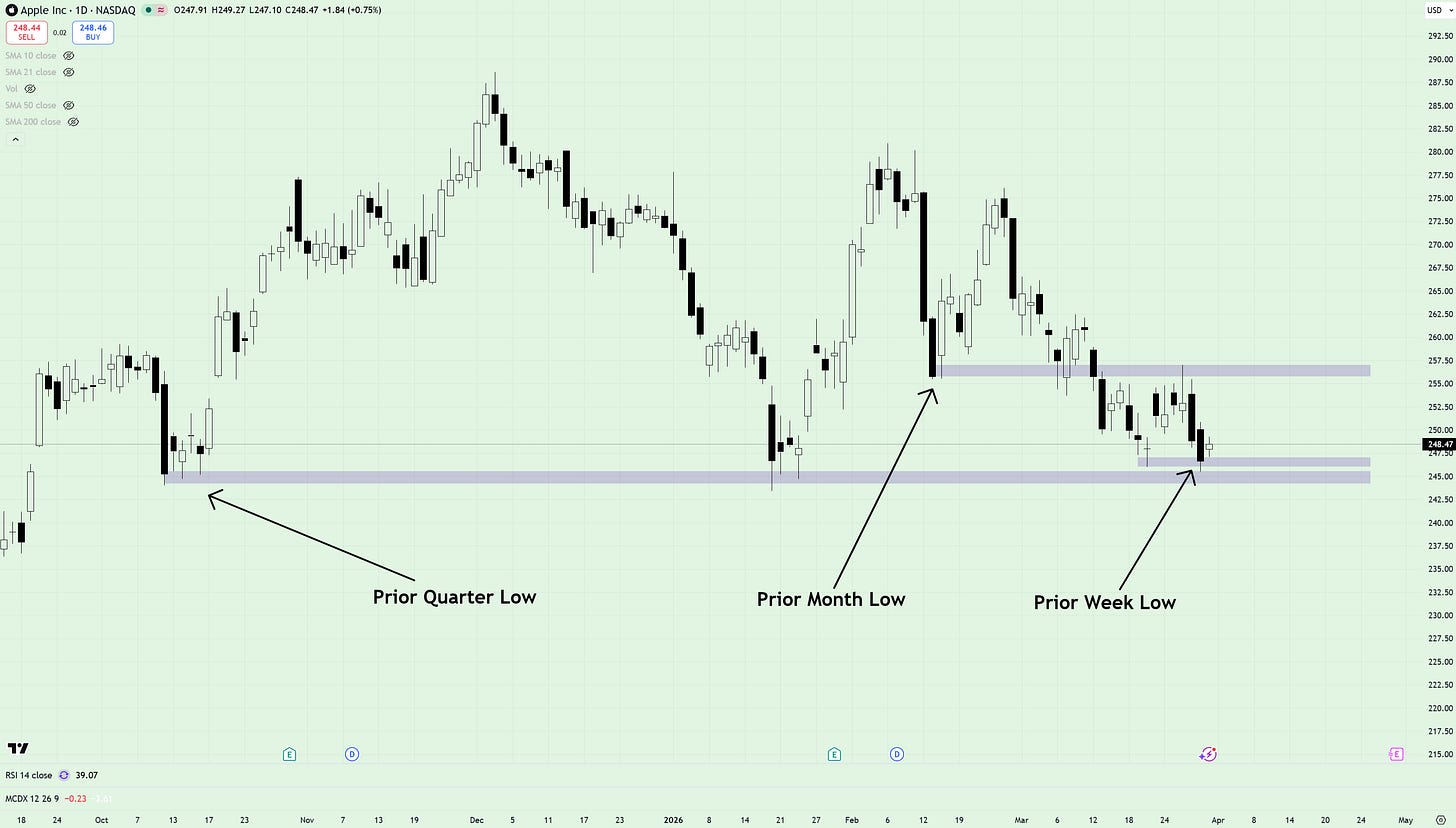
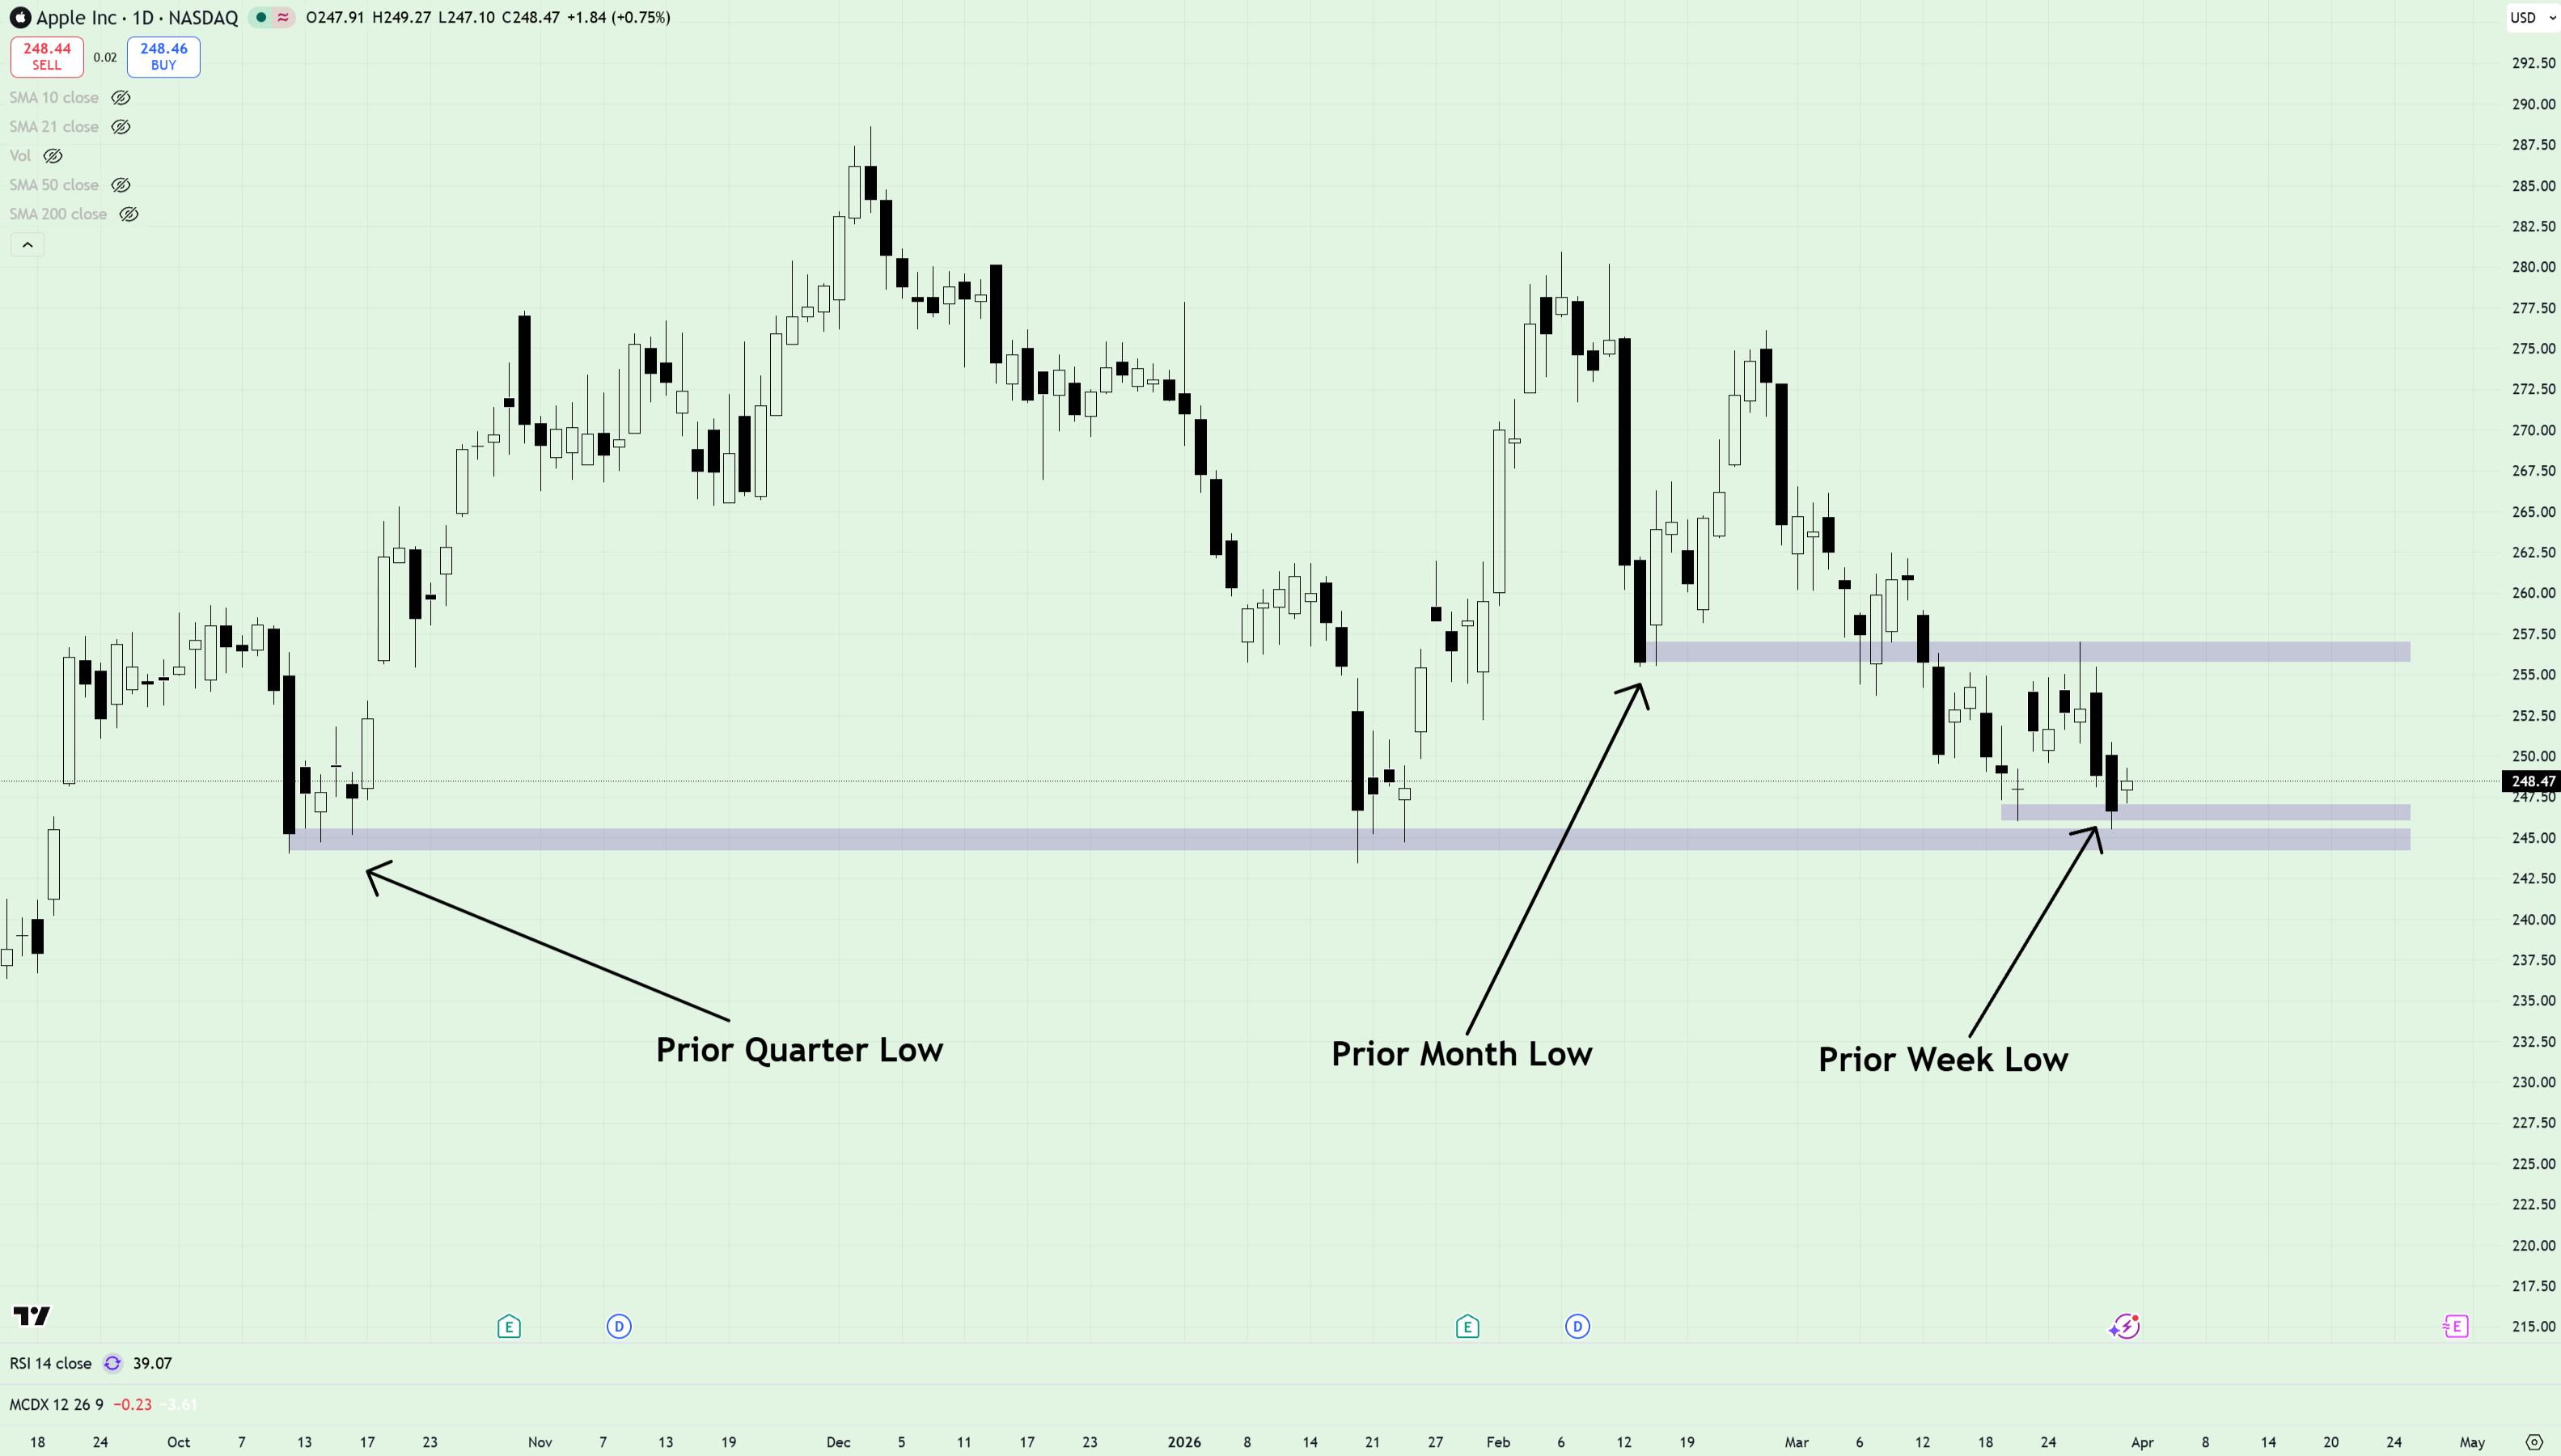
This particular part of the puzzle is especially useful when markets are weak - as is presently the case. For example, plenty of traders are interested in catching falling knives right now - let’s take AAPL as an example.
Using my system of observing full timeframe confluence, I know to avoid it like the plague. Why? Not only has Apple broken below the prior week’s low, it’s also below the prior month’s low - and the prior quarterly low!
So What’s the Trade?
Given the current market environment, knowing where to look is half the battle. Whilst the masses are fixated on calling tops/bottoms, drooling of mega cap drawdowns or even dabbling in crypto, smart money is allocated in areas that continue to work.
Here’s one I’ve shared already - AZN. Price continues to hold above the key pivot around $175, the retracement down the golden pocket is in play and oscillators curling up from oversold levels suggest this thing wants higher - with the obvious target being the prior high at ~$212. A break below this week’s low is the out.
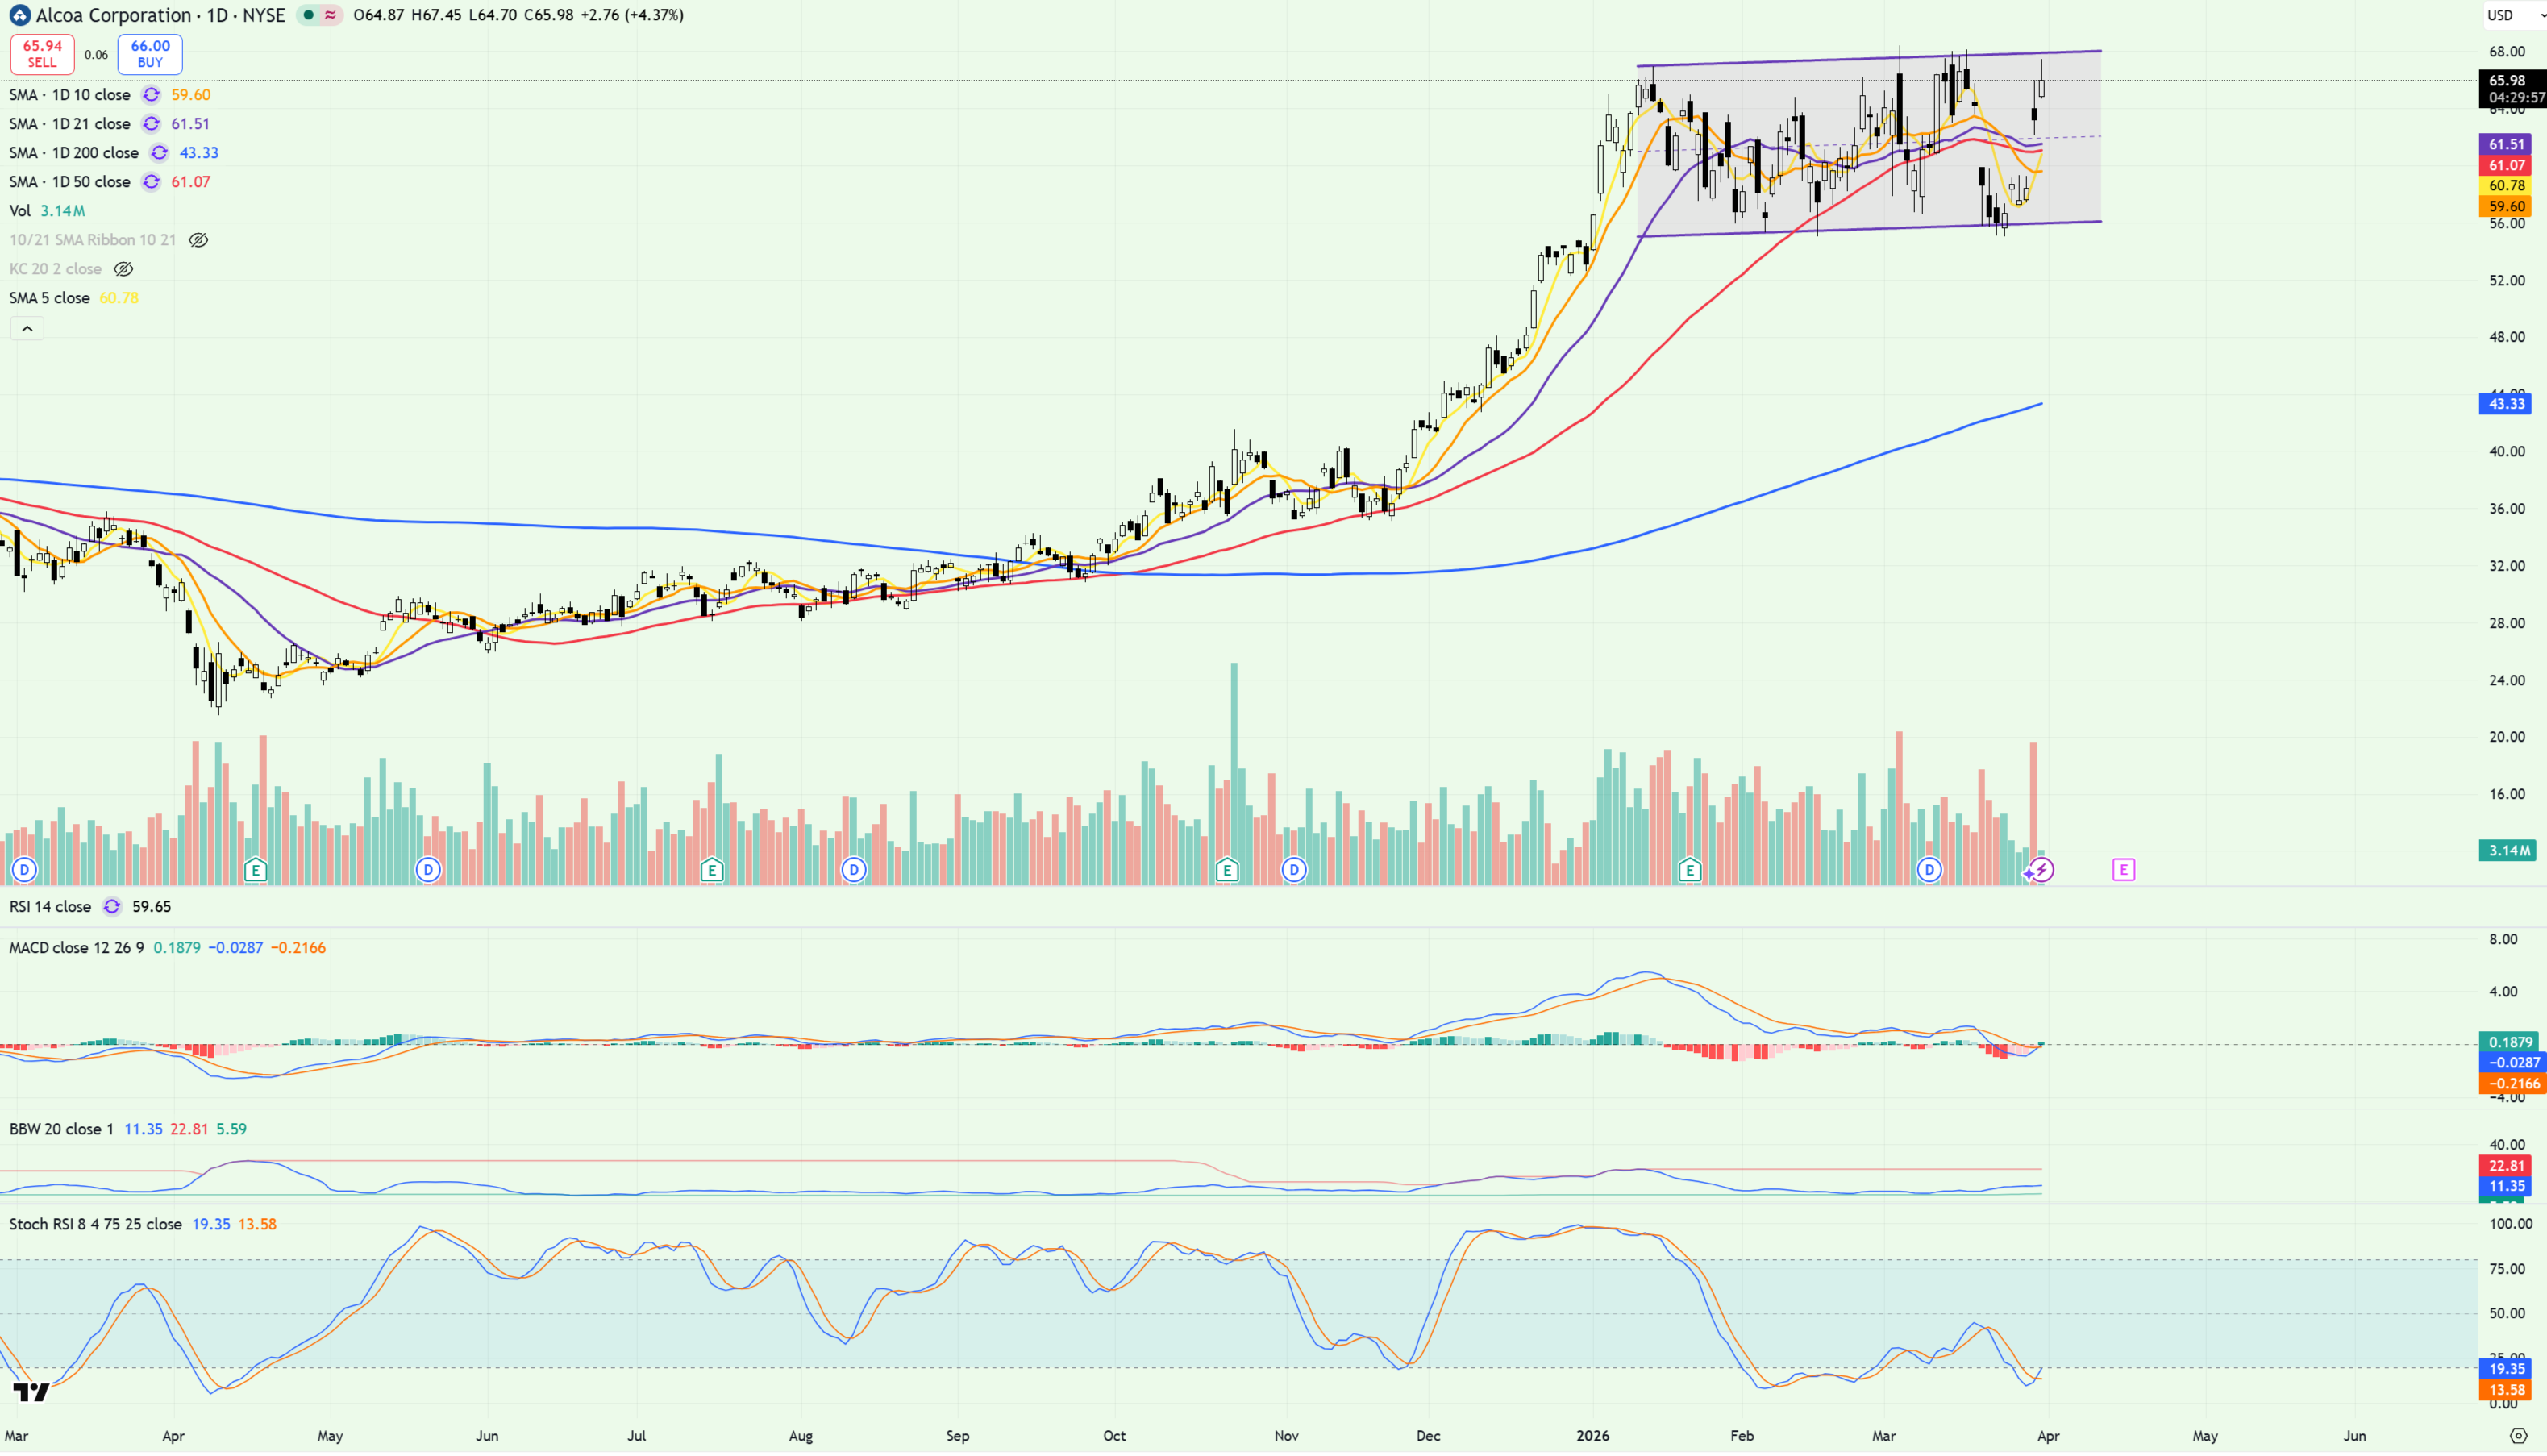
AA is another ticker I’m trading right now as it aligns with everything you want to see when entering a trade. Price has been consolidating within a tight range since Jan, allowing overbought oscillators to cool. Said oscillators are now curling up, signaling potential upside and a break above $68. Volume has been confirming the trend and we’re well above the prior week’s low.
Different Swings for Different Markets
So you want to get rich and make your first million in the markets? Me too.
But here’s the kicker: the current trading landscape isn’t facilitating that right now.
Whereas in 2025 high beta was ripping, breakouts were sticking and every Mag 7 name was up and to the right, today’s market is choppy, weak and bifurcated.
What this means is that outside of day trading - which is a different skillset to the one I possess - overnight riches are harder to find than social media would have you believe.
Real progress in markets tends to come from recognizing alignment early, managing risk properly, and giving good setups enough time to play out.
These are the kind of trades I’ll be making until we see meaningful signs of strength return. And when risk does come back, you bet I’ll be putting cash to work.
That’s exactly why I’m launching trade alerts.
They won’t be part of the free tier. But what subscribers will get is consistency, clear levels, repeatable process, and real positioning around the setups I’m actually trading - not hindsight charts after the move’s already gone.
No noise. No guesswork. Just actionable structure when it matters most.
Because in markets like this, discipline and timing beat excitement every time. 📈