
Cast Away
Markets at an uncomfortable crossroads

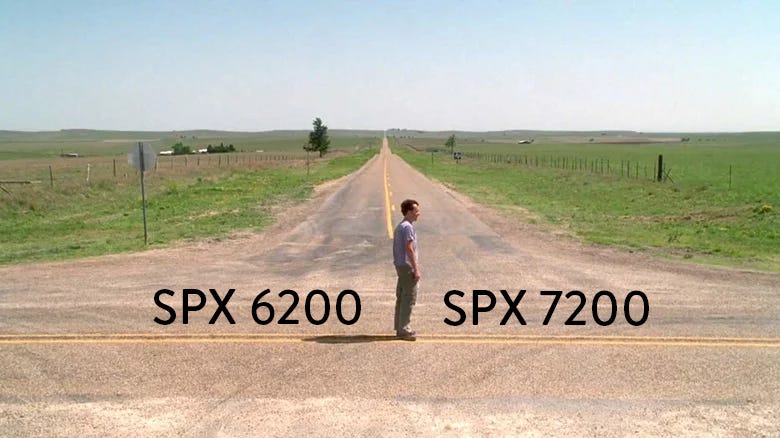
At the end of Cast Away, there’s no grand speech. No swelling music. Just Chuck Noland, a dusty road, and four empty directions stretching out into the distance.
After years of isolation, survival, and watching the horizon for something — anything — to move, he finally stands still. Not because the journey is over, but because the next part of it is about to begin.
That’s where U.S. indices find themselves this week.
The noise of year-end fades, the holiday liquidity drains out of the tape, and participation quietly returns to the wheel. The trend that carried us here is still visible in the rear-view mirror — but the road ahead is no longer a straight line.
It’s a set of possibilities, each one asking the same question: continuation, consolidation, or something altogether less comfortable.
The Uncomfortable Truth
Whilst the primary trend remains up and to the right (more on this later), the bears have arguably the strongest setup they’ve had in months right now.
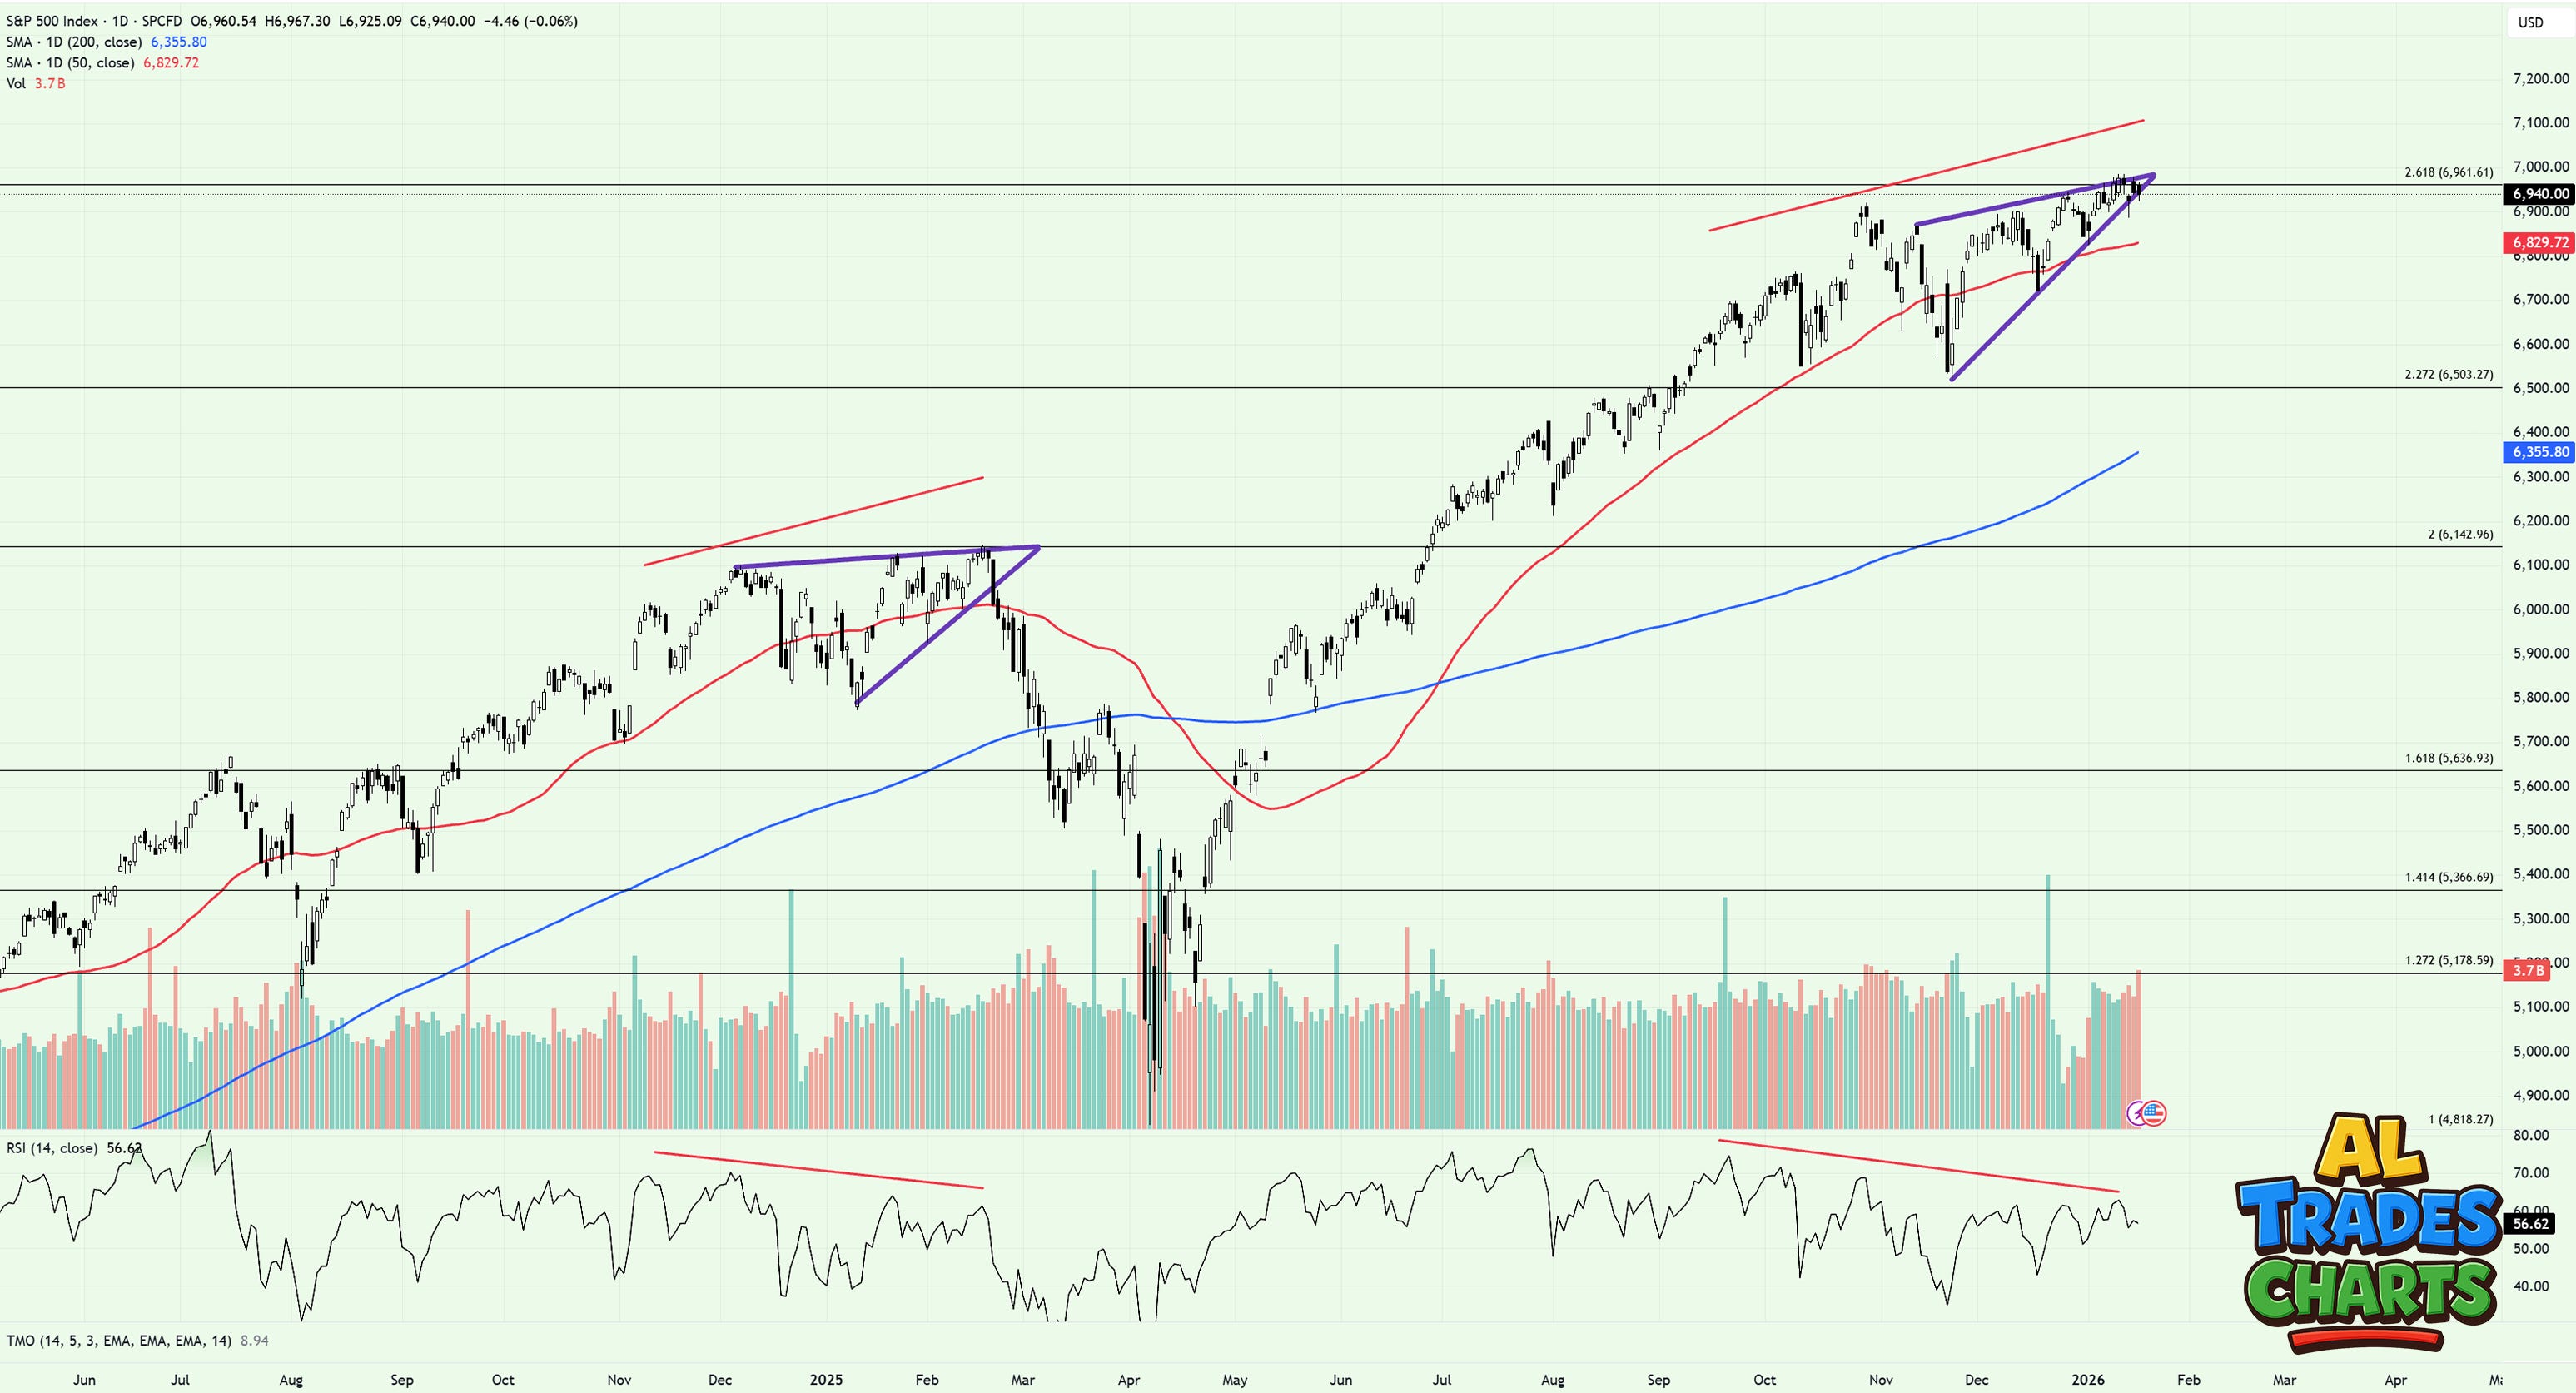
As discussed last week, the setup looks eerily similar to the one that resulted in a 20% drawdown in Q1 of last year:
Price has made new ATHs without the RSI confirming, signaling a bearish divergence on the daily and weekly timeframe
Price has formed an ascending wedge at a key Fibonacci extension, signaling a potential big move is pending in either direction
Volume has increased significantly on down days, with lighter volume on up days
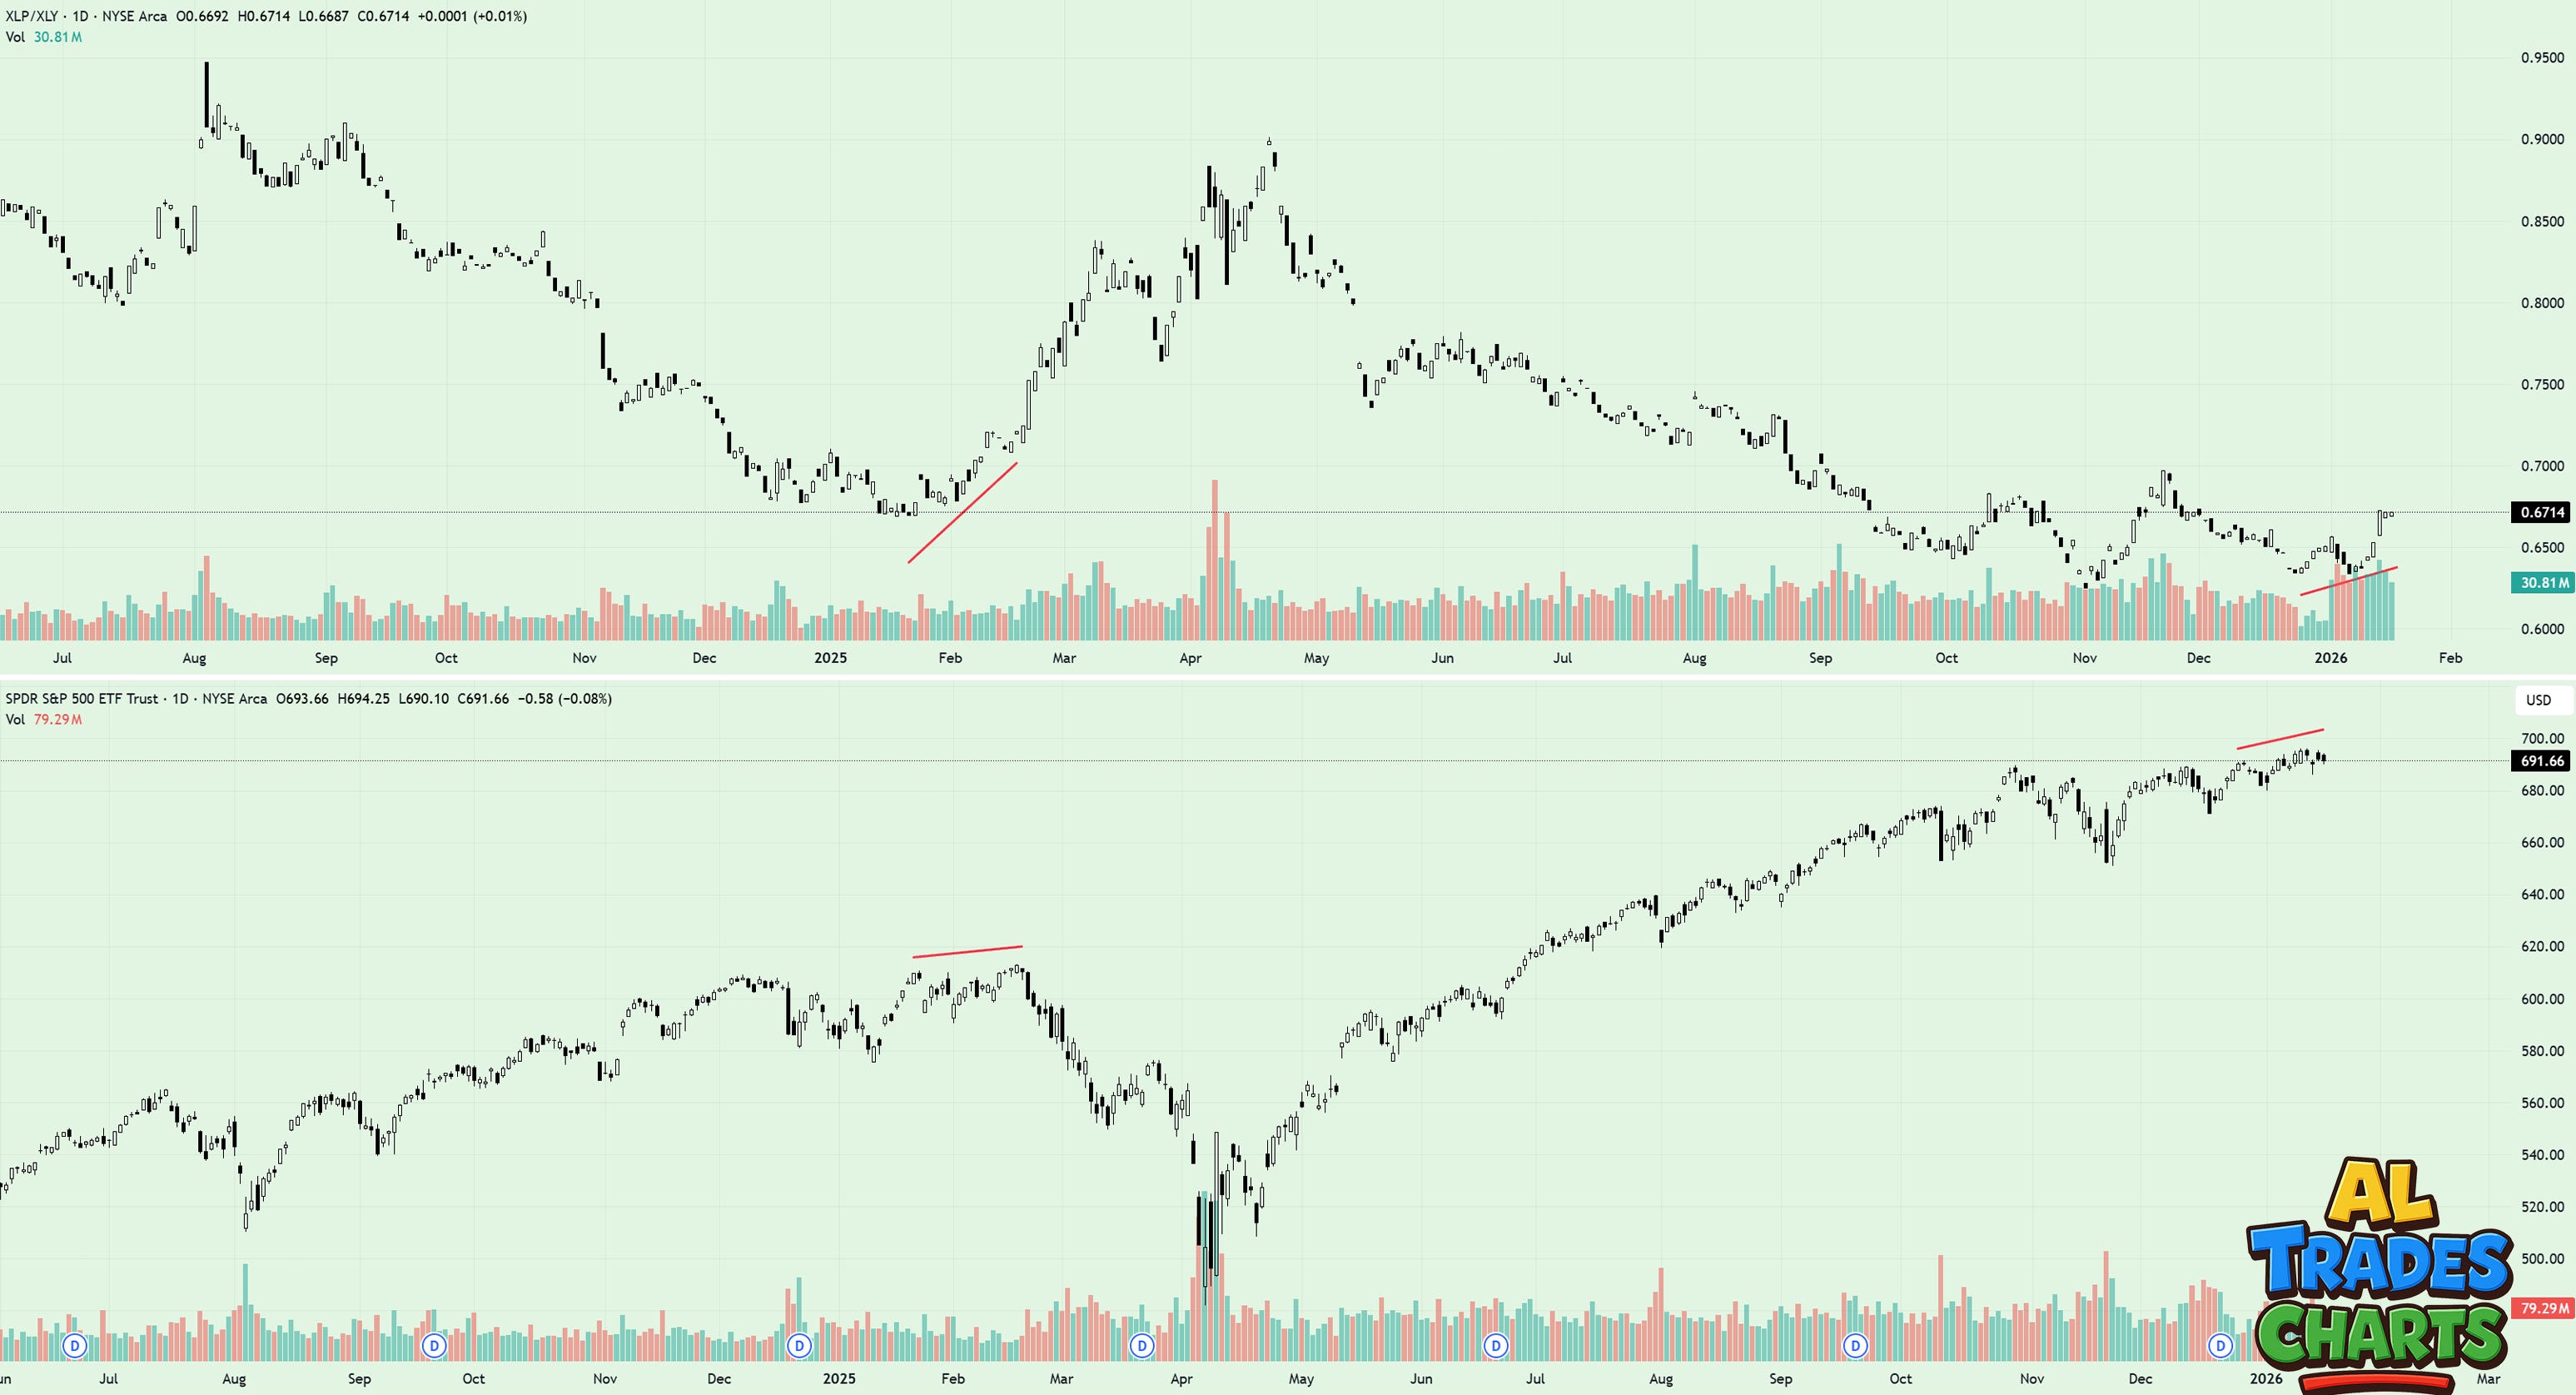
Additionally, another eerily similar setup can be found on XLP/XLY relative to SPY.
As shown in the chart above, whilst SPY has made new highs throughout January, Staples relative to Discretionary stocks haven’t yet made a new low - signaling another divergence that plays in the bear’s favor.
And the weakness doesn’t stop there.
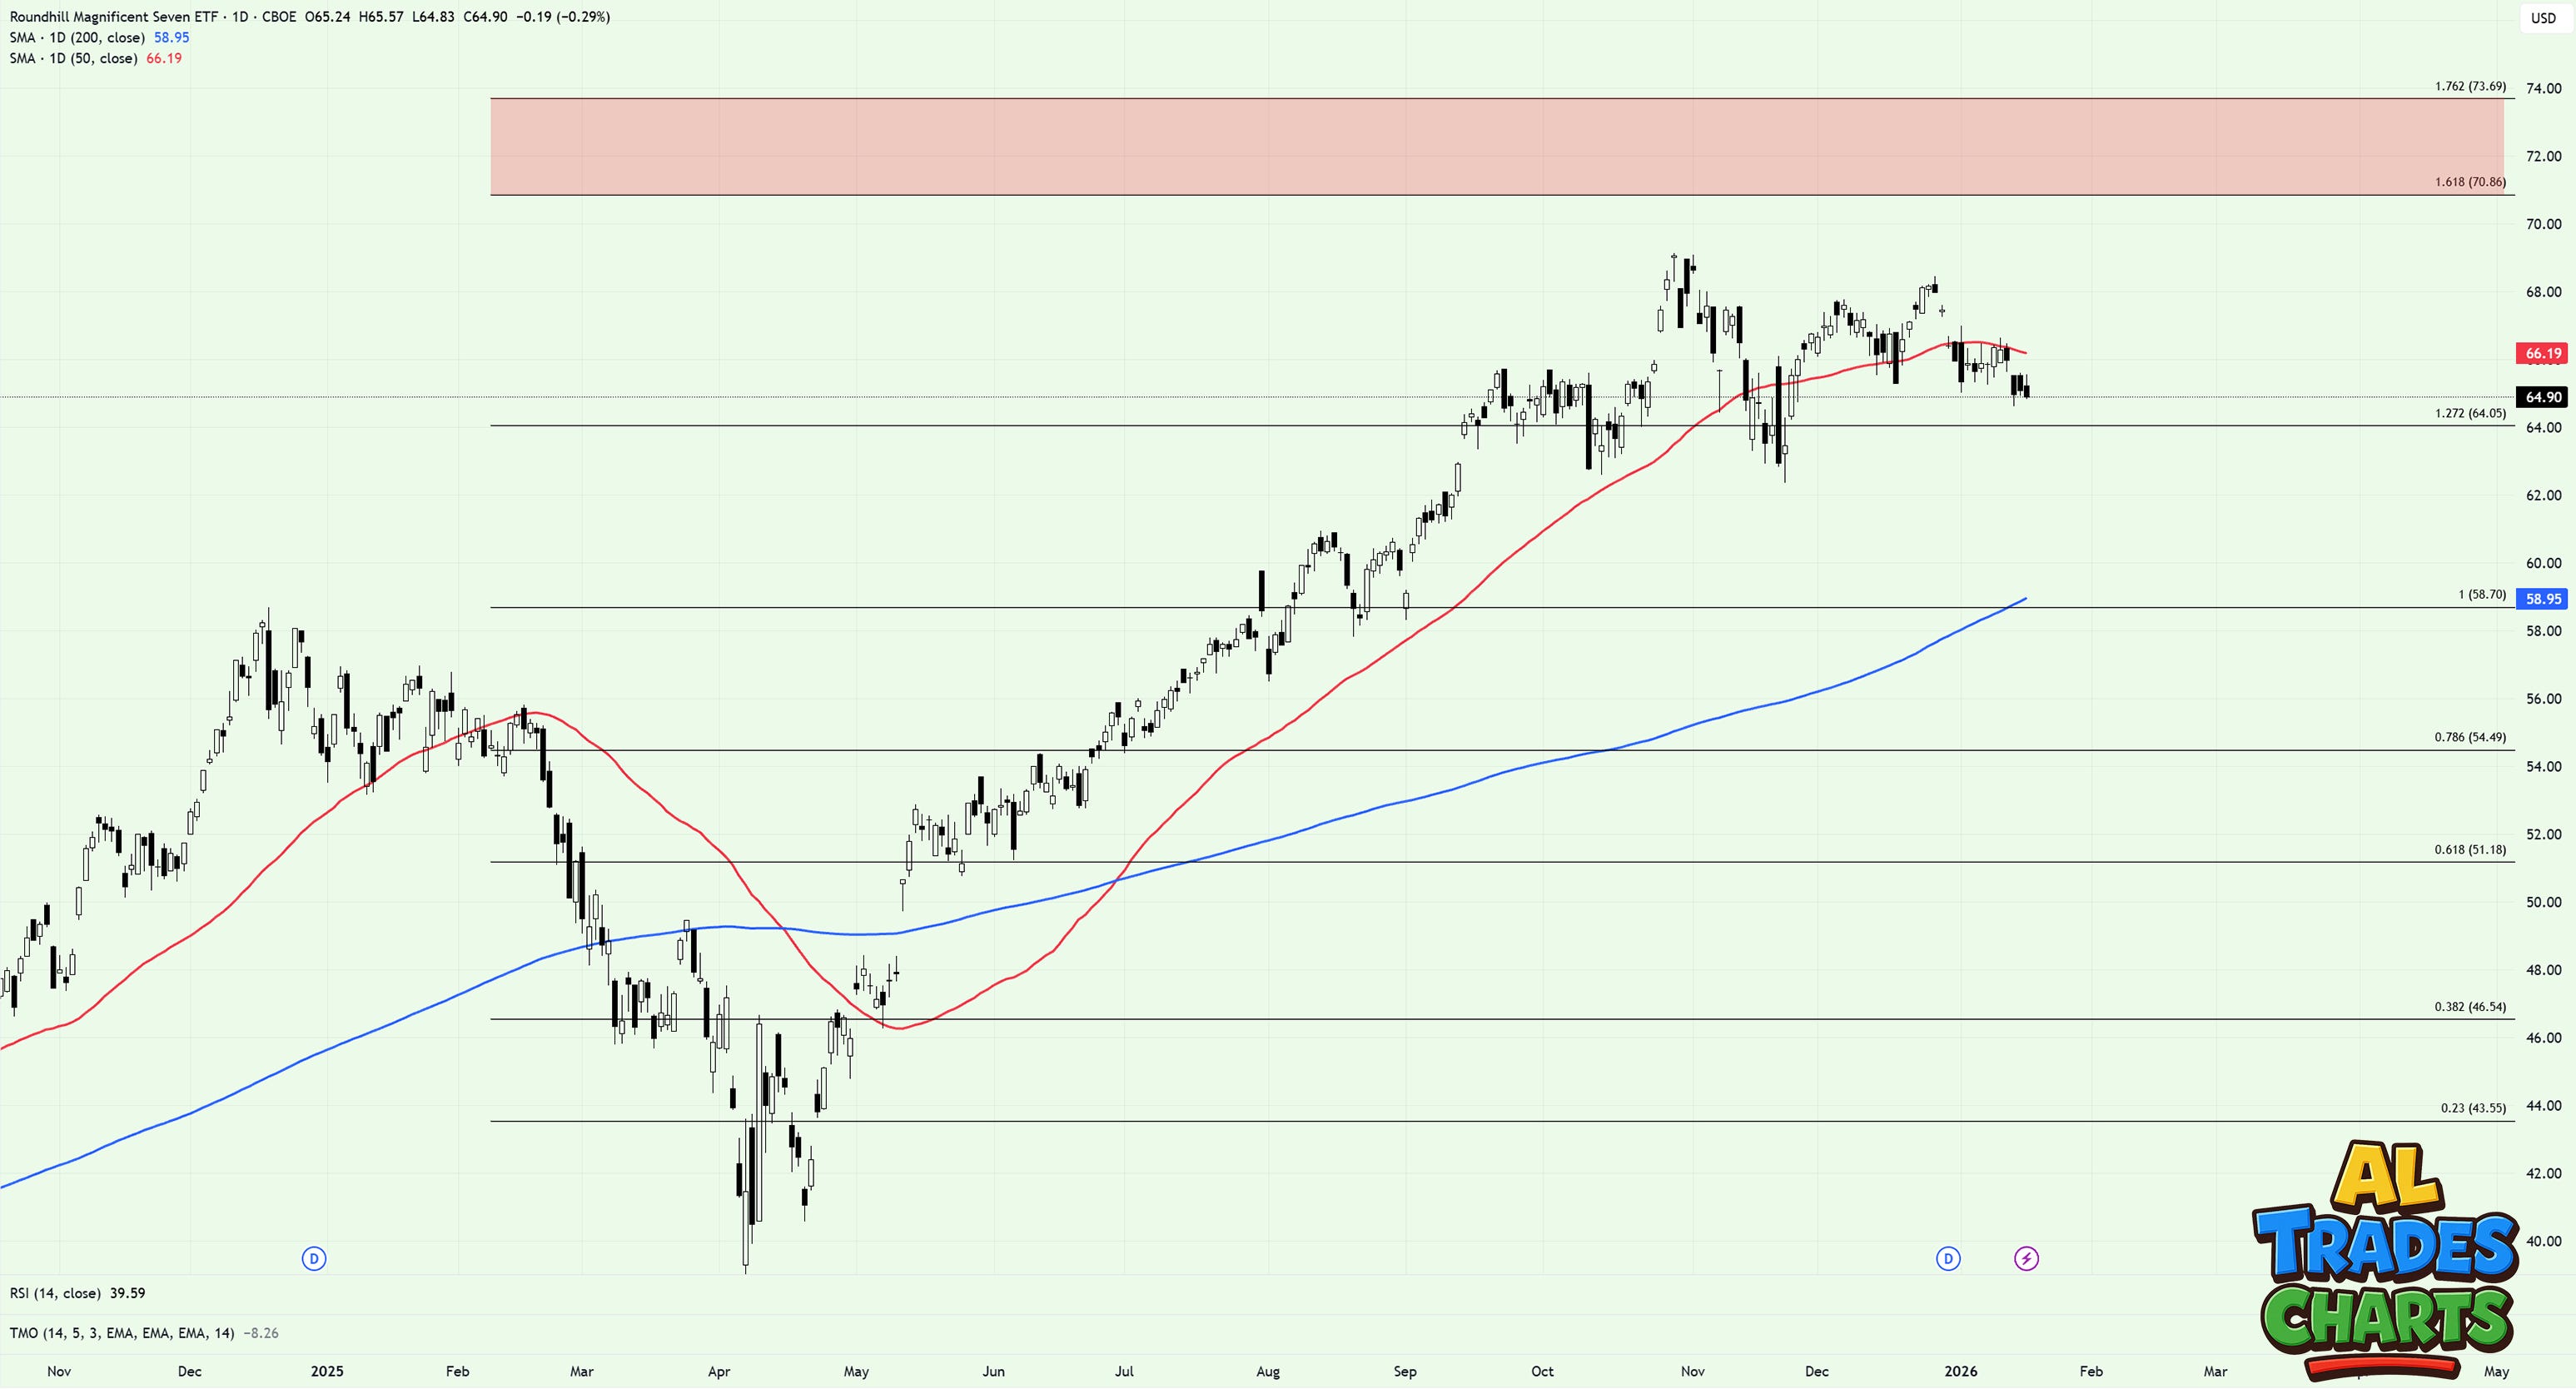
MAGS - the ETF containing the seven biggest stock in the market - has dropped below its 50dma and hasn’t made a new high since October 2025.
This matters because it signals that the market’s heaviest hitters - the same stocks people argued were the only ones dragging the indexes higher last year - haven’t yet shown up to the party in 2026.
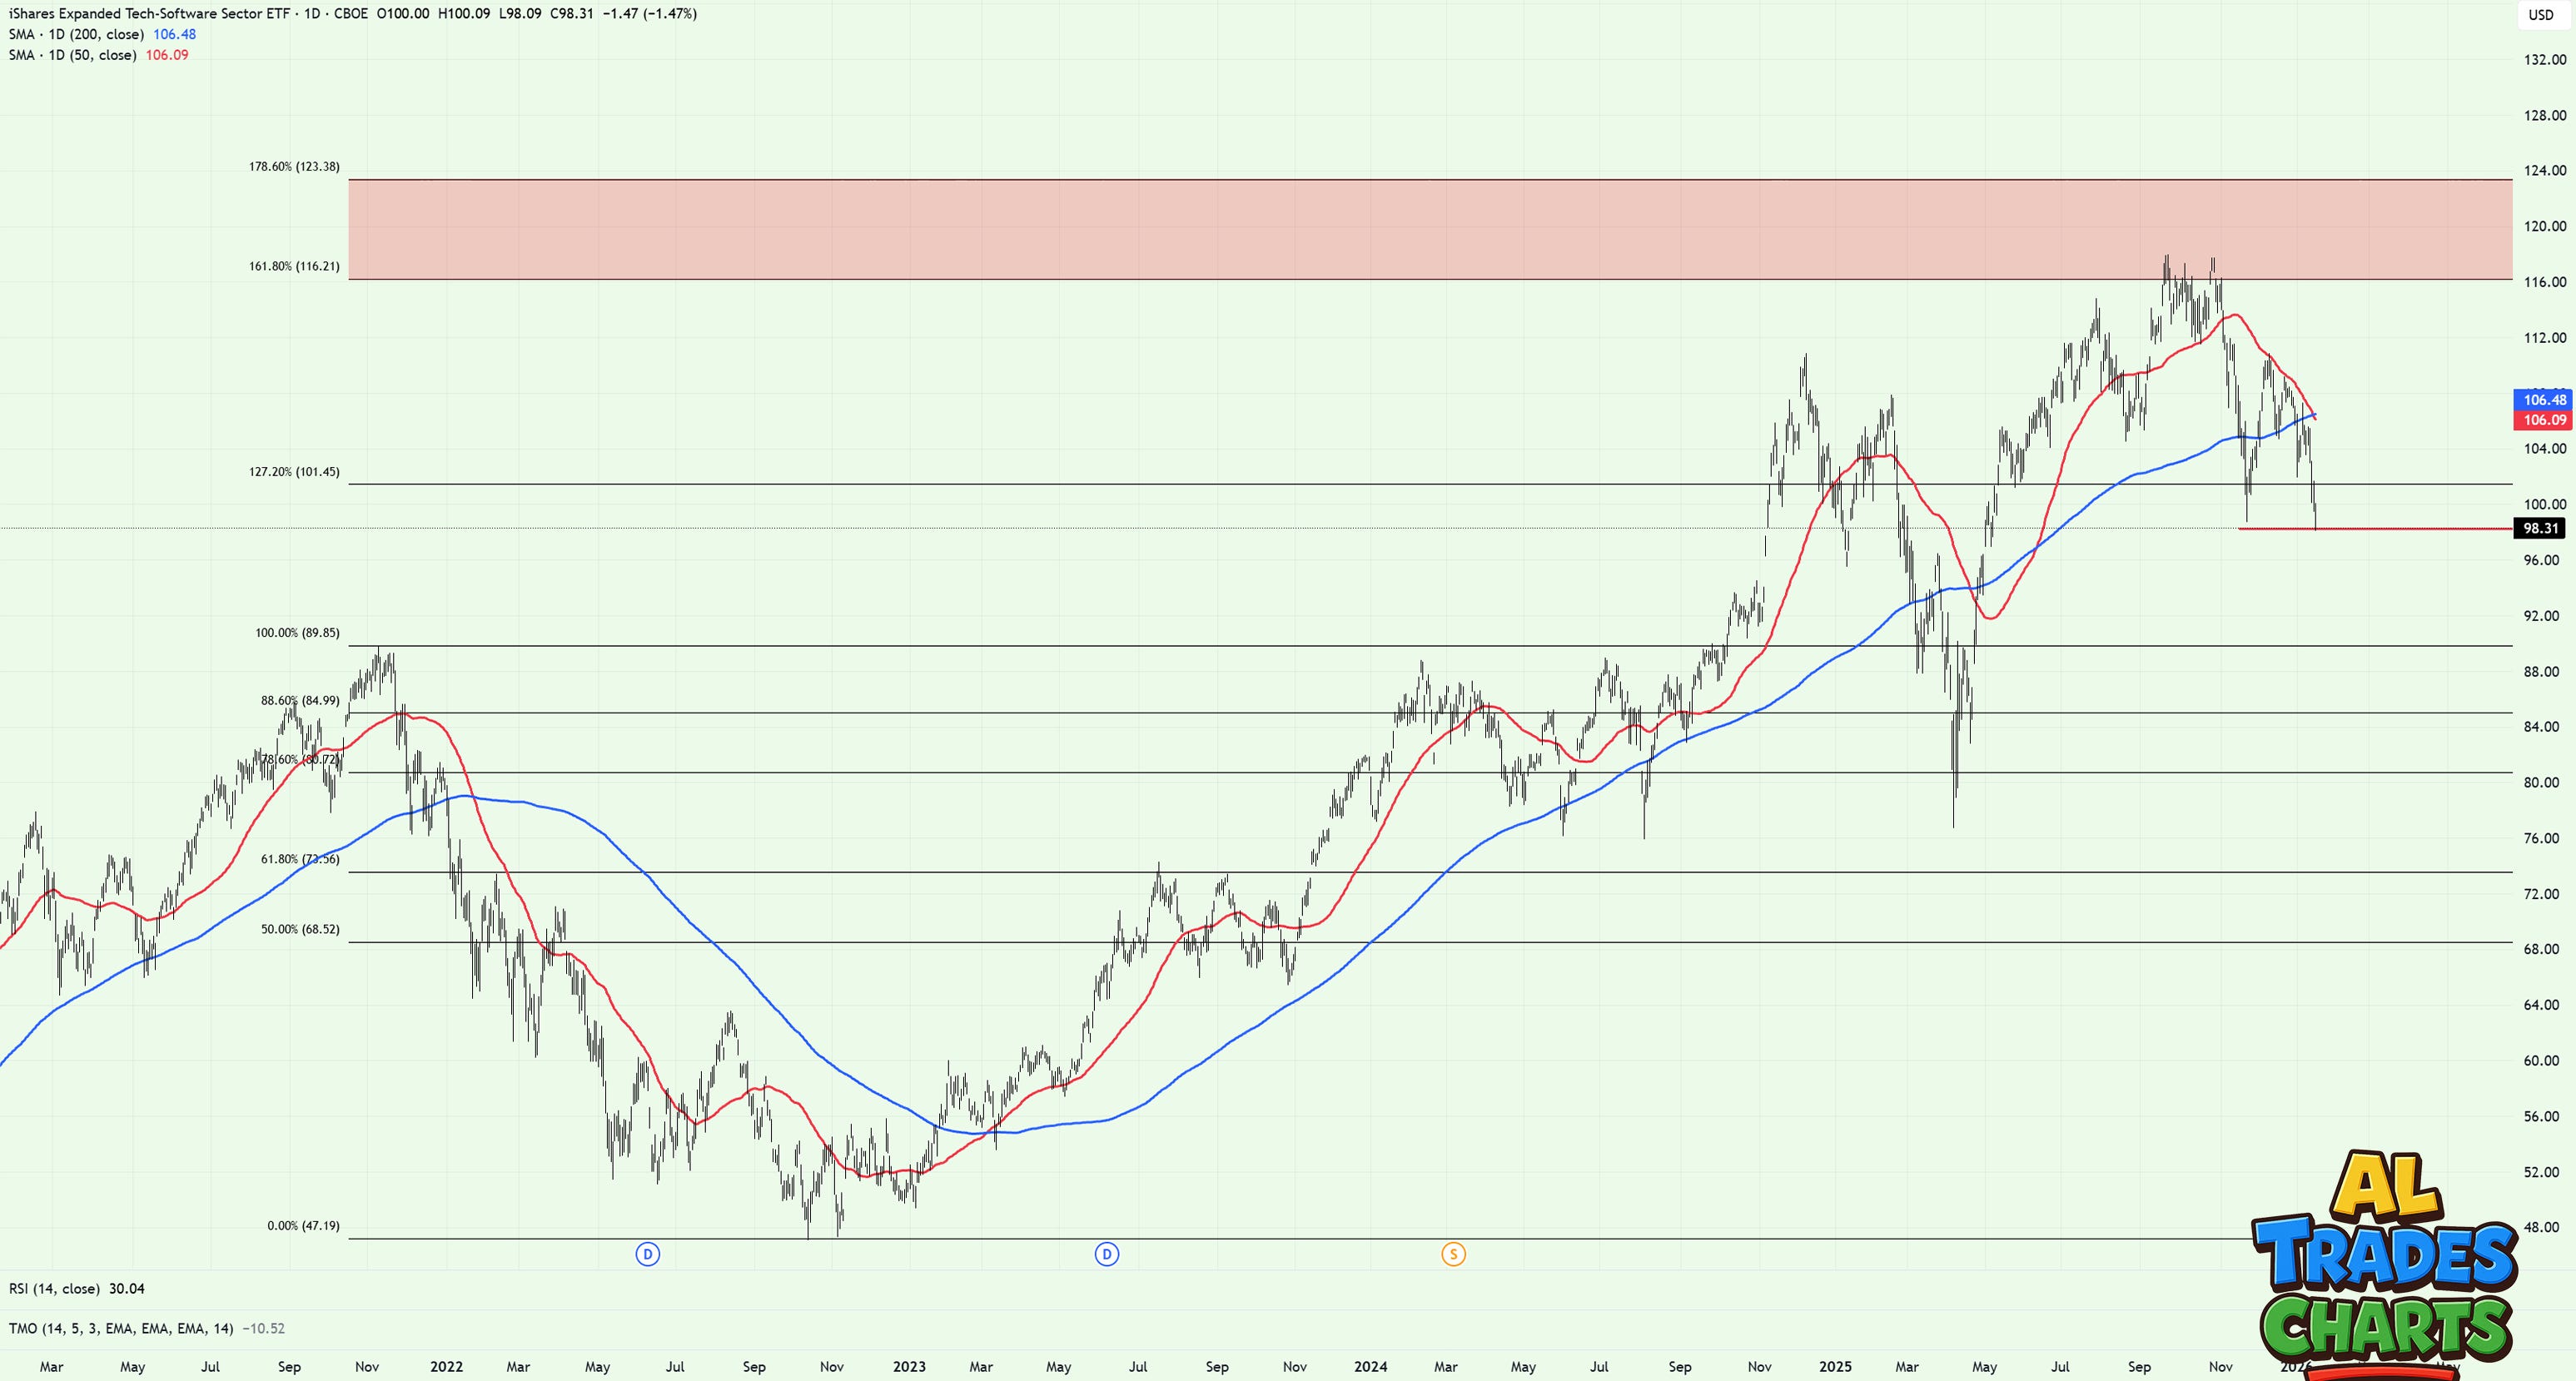
And lastly, software.
IGV - iShares Expanded Tech-Software - looks incredibly weak having dipped below a declining 50dma and 200dma, with the key 127.2 fib offering no support at the present time of writing.
Why 2026 might actually be different
Make no mistake. I’m not taking any of these charts lightly.
As technical analysts, it’s out job to assess all the data at our disposal - even the ones we don’t like.
But alongside the scary charts doing the rounds, it’s just as important to weigh the ones that don’t favor the bears — balancing probabilities on both sides before jumping to conclusions.
Thankfully, I have two custom indicators that I can fall back on when moments like this appear in the markets.
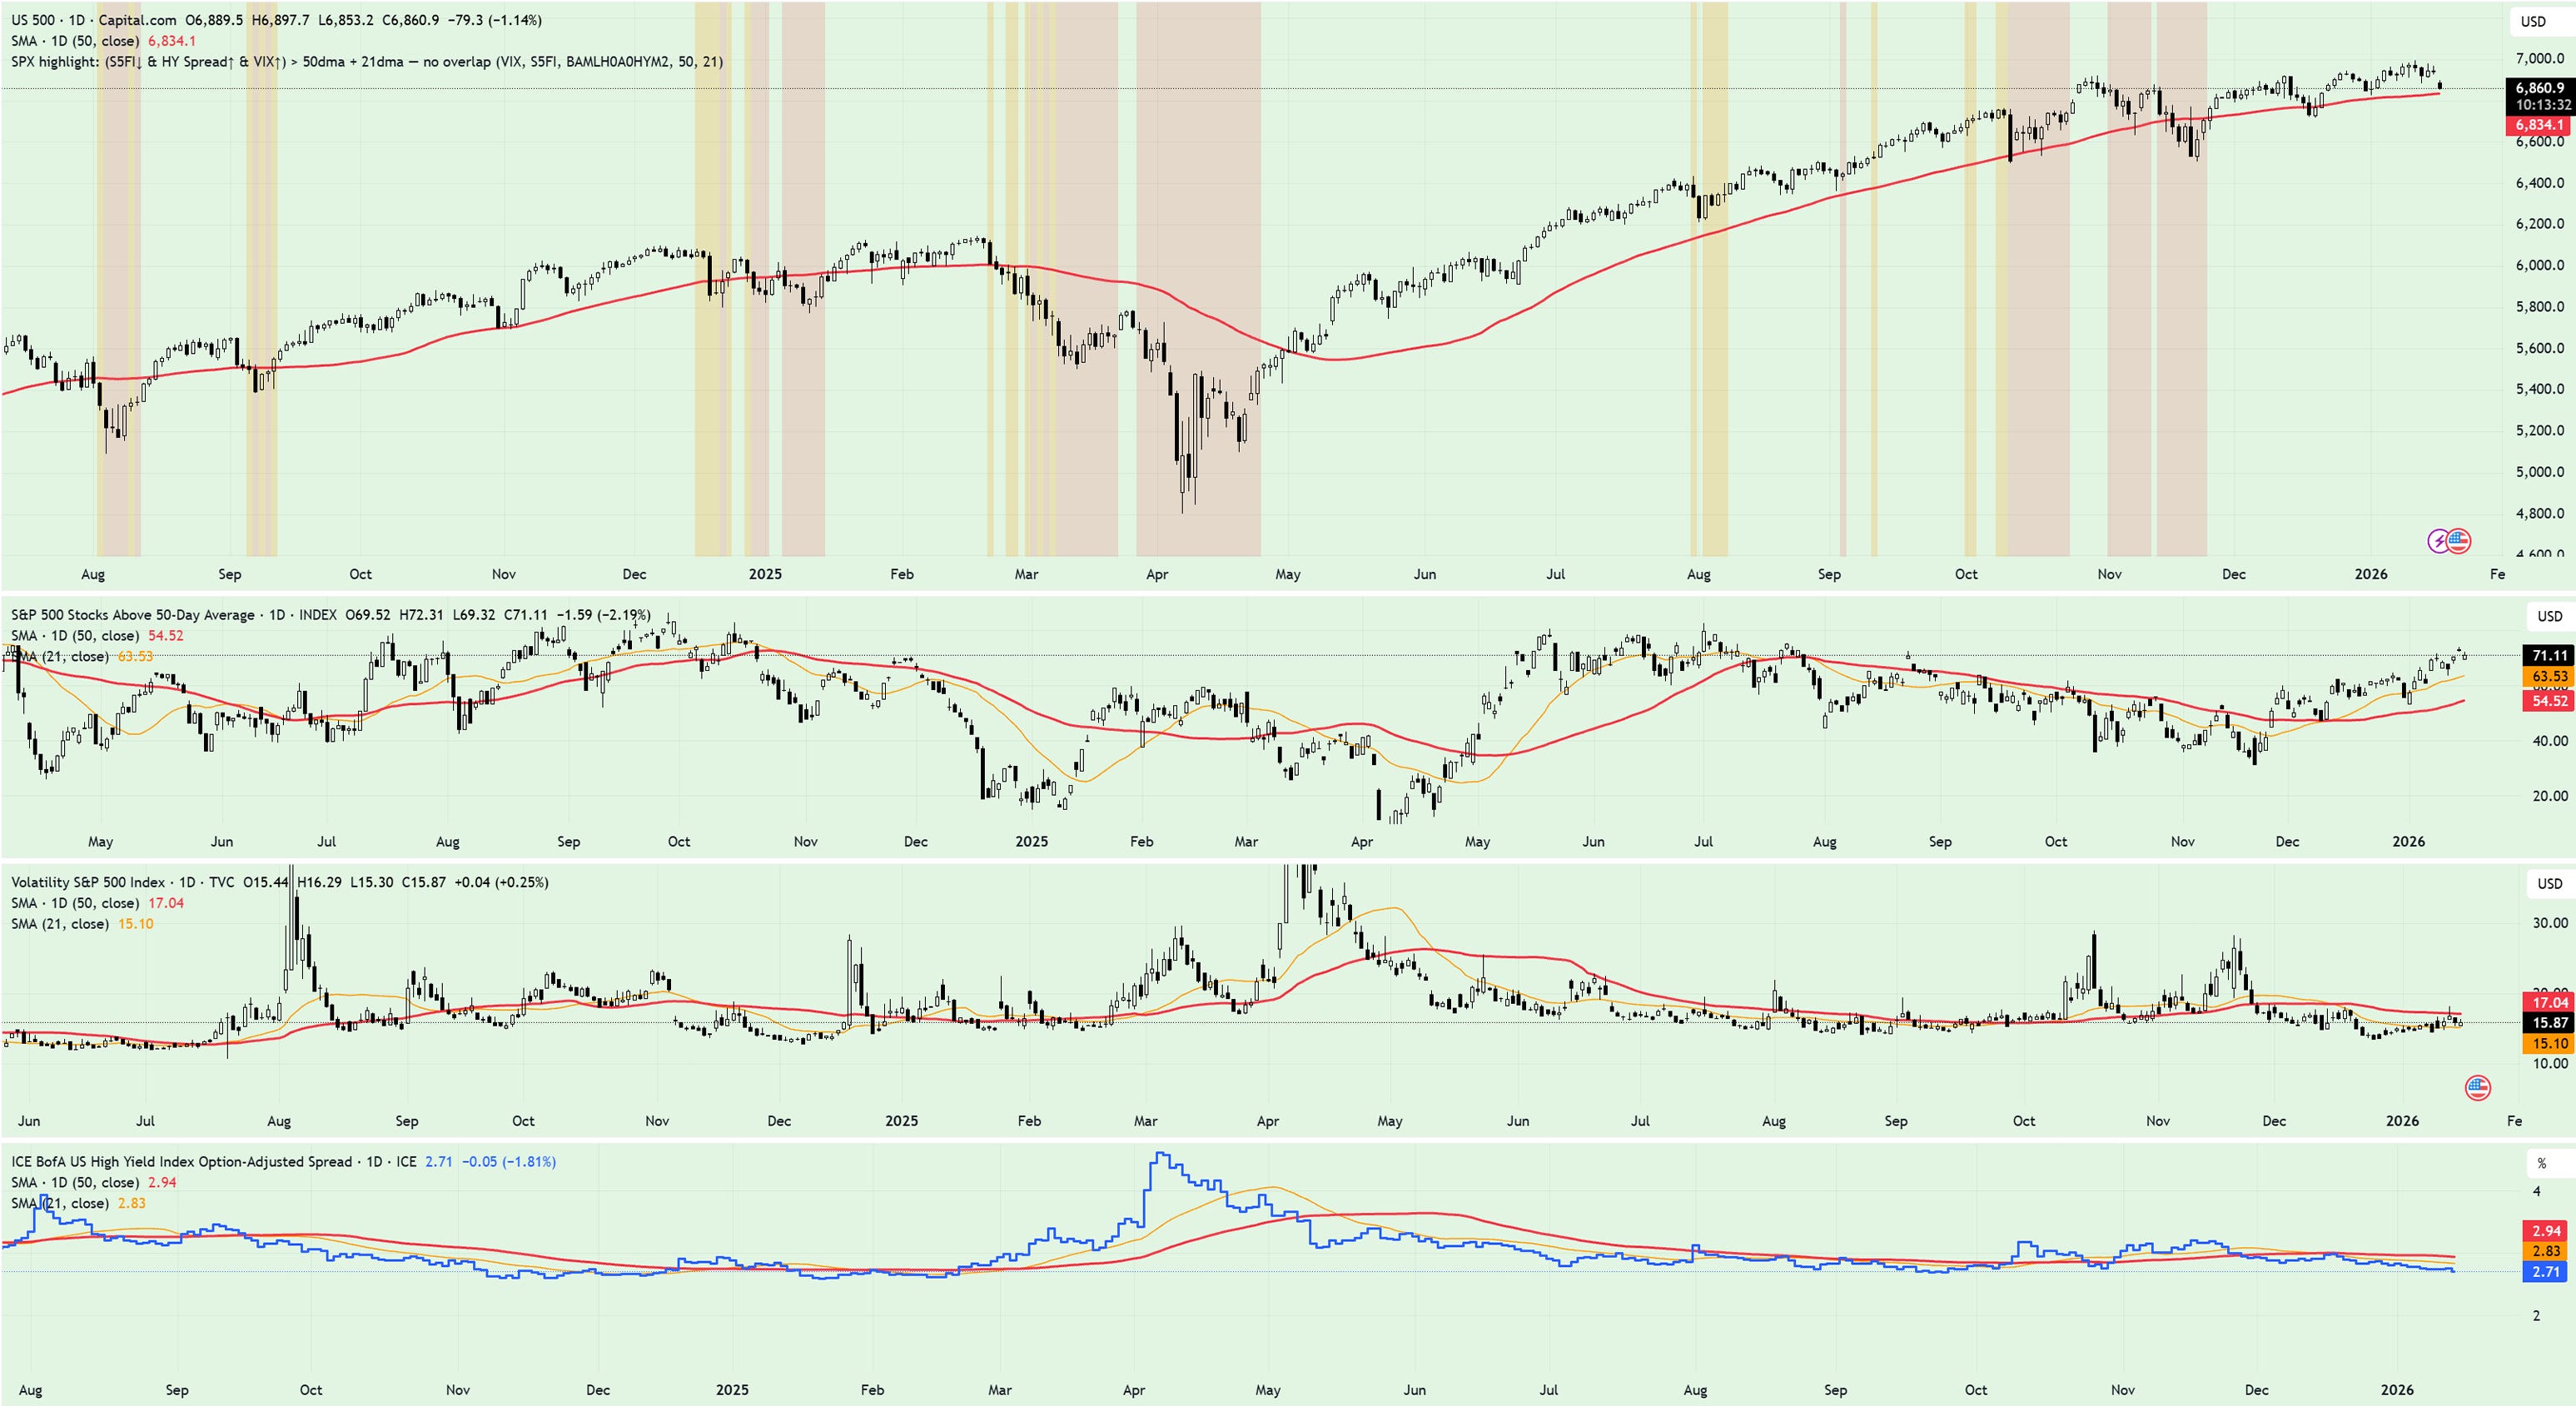
I appreciate it’s not the cleanest setup, so allow me to explain:
When red shaded bears appear on the top panel (SPX) it signals instances when all three of the following have occurred simultaneously:
The percentage of stocks above their 50dma in the S&P500 has fallen below its 50dma
The VIX is above its 50dma
Credit spreads - which currently sit at historically low levels - rise above the 50dma
If you’re asking yourself what the orange shaded bars indicate - it’s the same as above, but replacing the 50dma with the 21dma (a pre warning system, rather than an out and out ‘risk off’ siren).
So where are we right now?
As the indicator clearly shows, we are not in the orange zone, or the red zone.
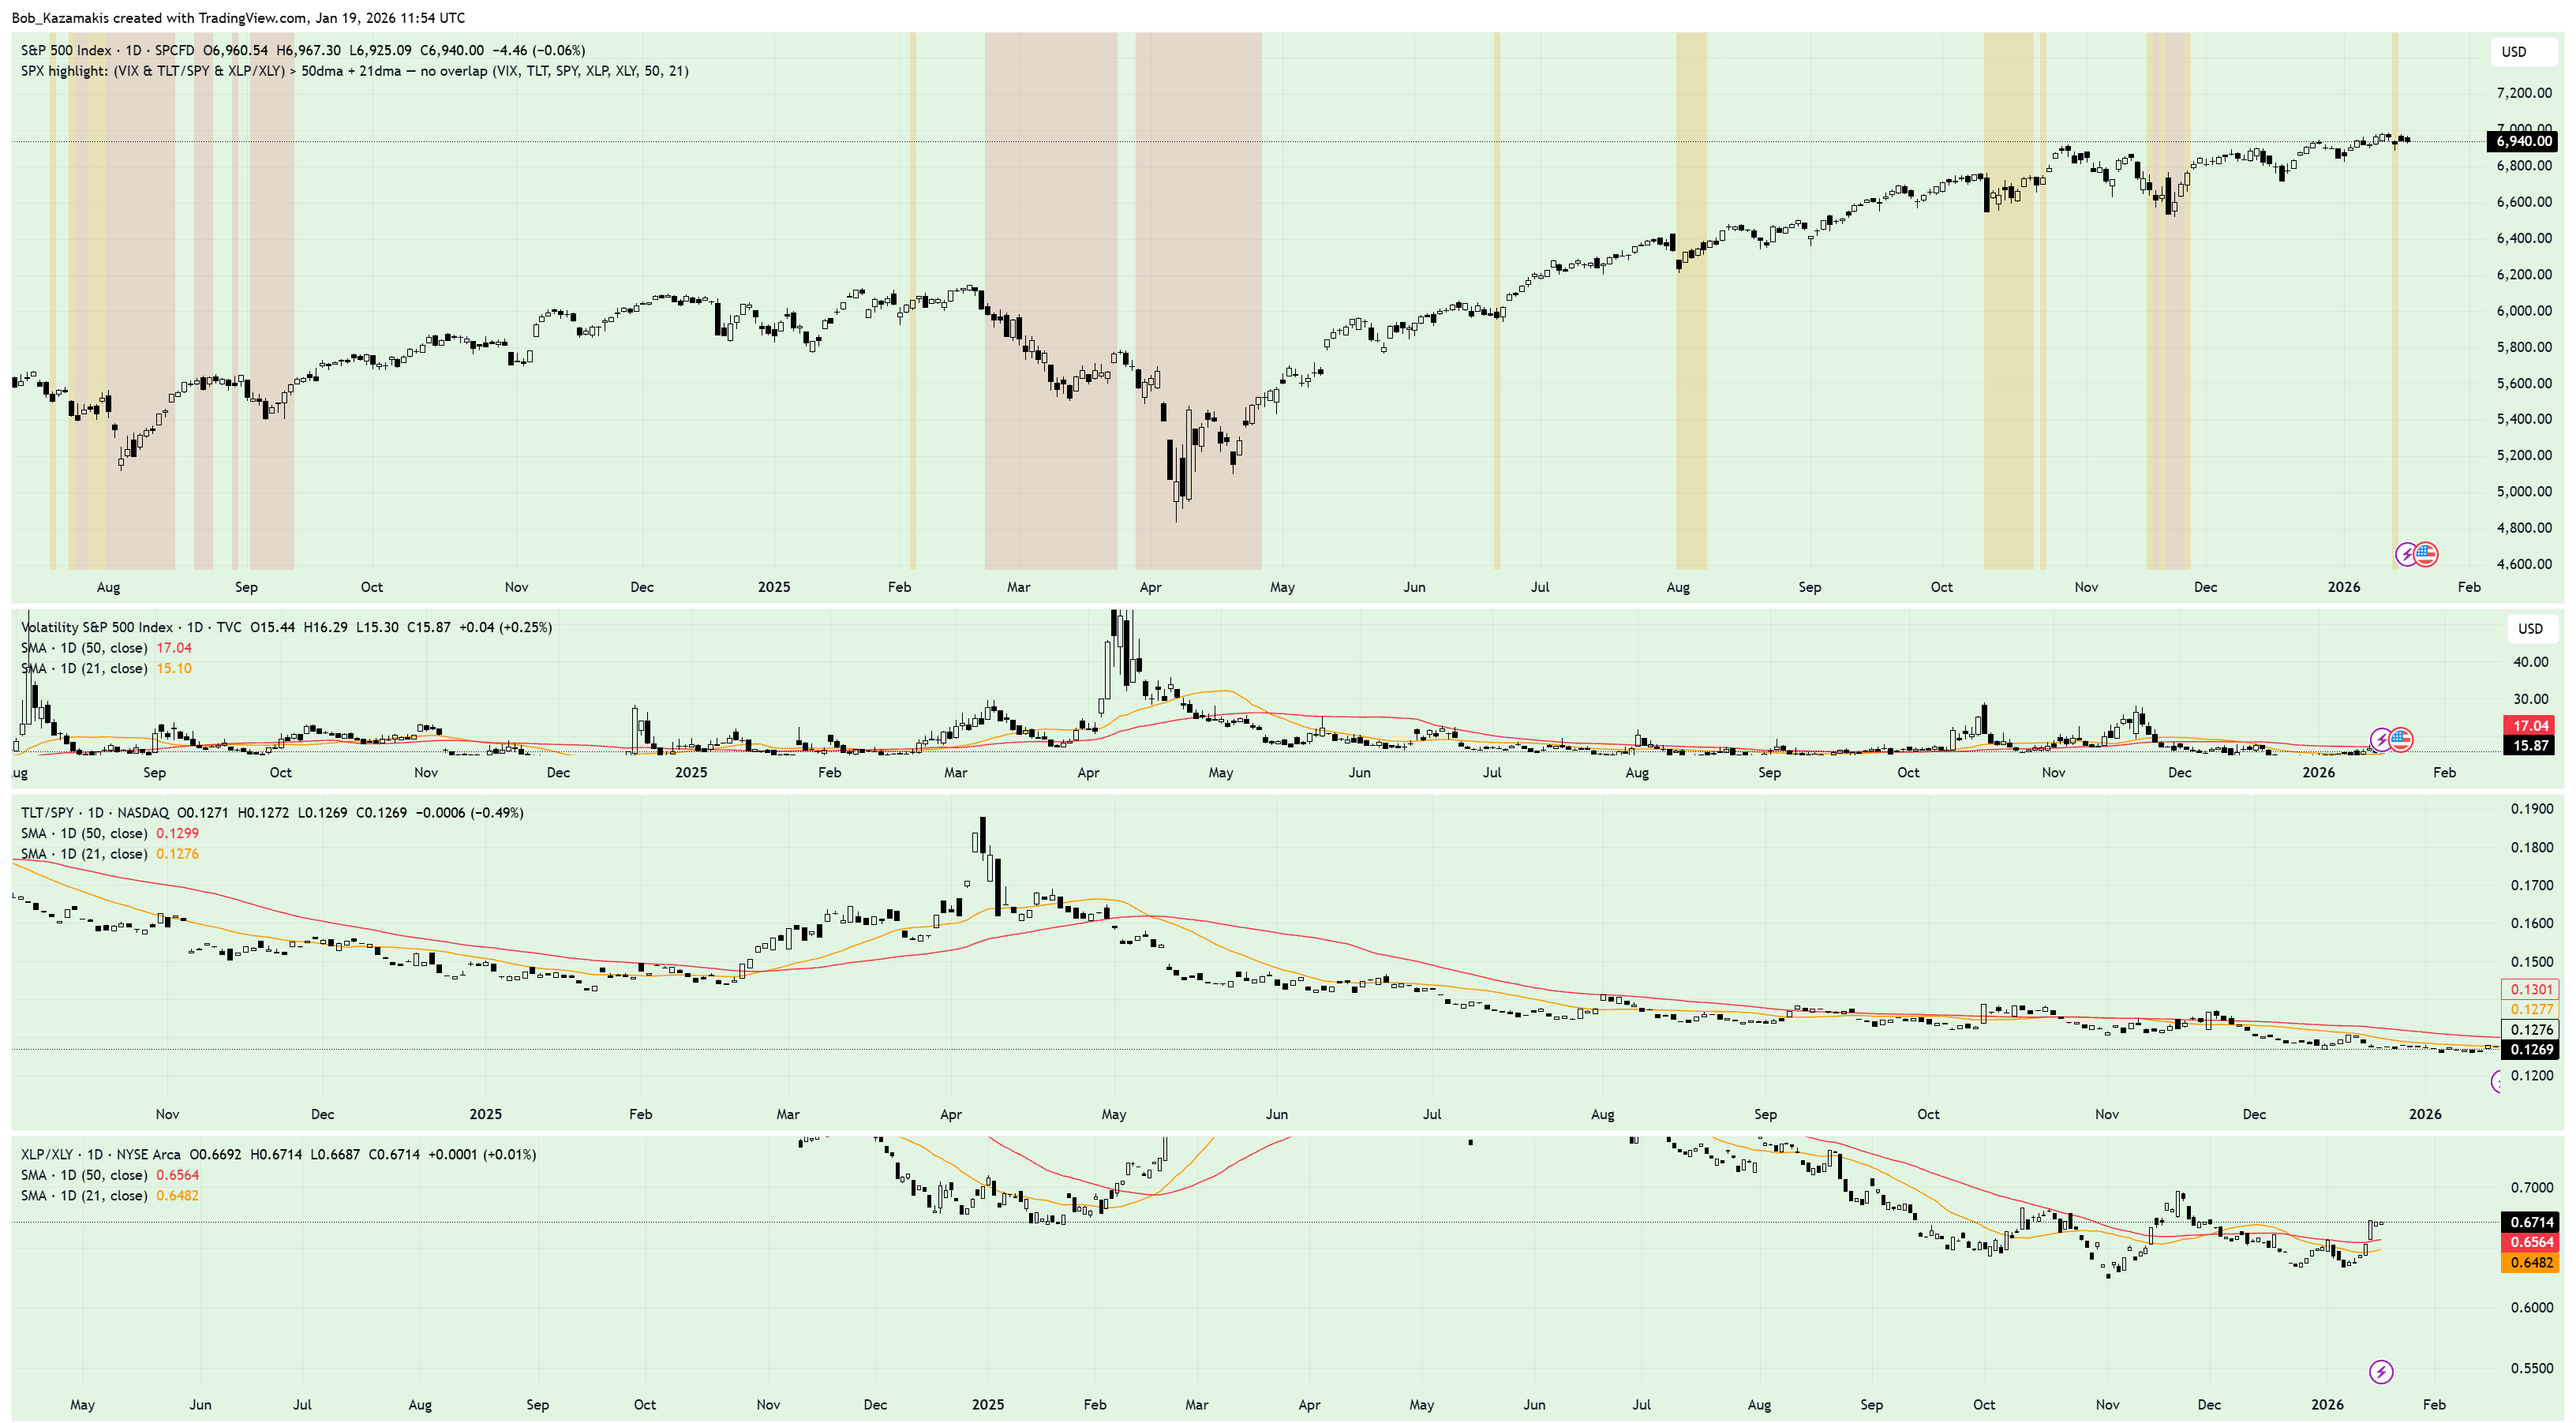
And the same rings true on my second custom indicator - which again fires when all three of the following have occurred simultaneously:
The VIX is above its 50dma
TLT/SPY is above its 50dma
XLP/XLY is above its 50dma
What’s interesting here is that although we saw an orange signal flash last week, it quickly resolved as SPX made new highs and volatility subsided.
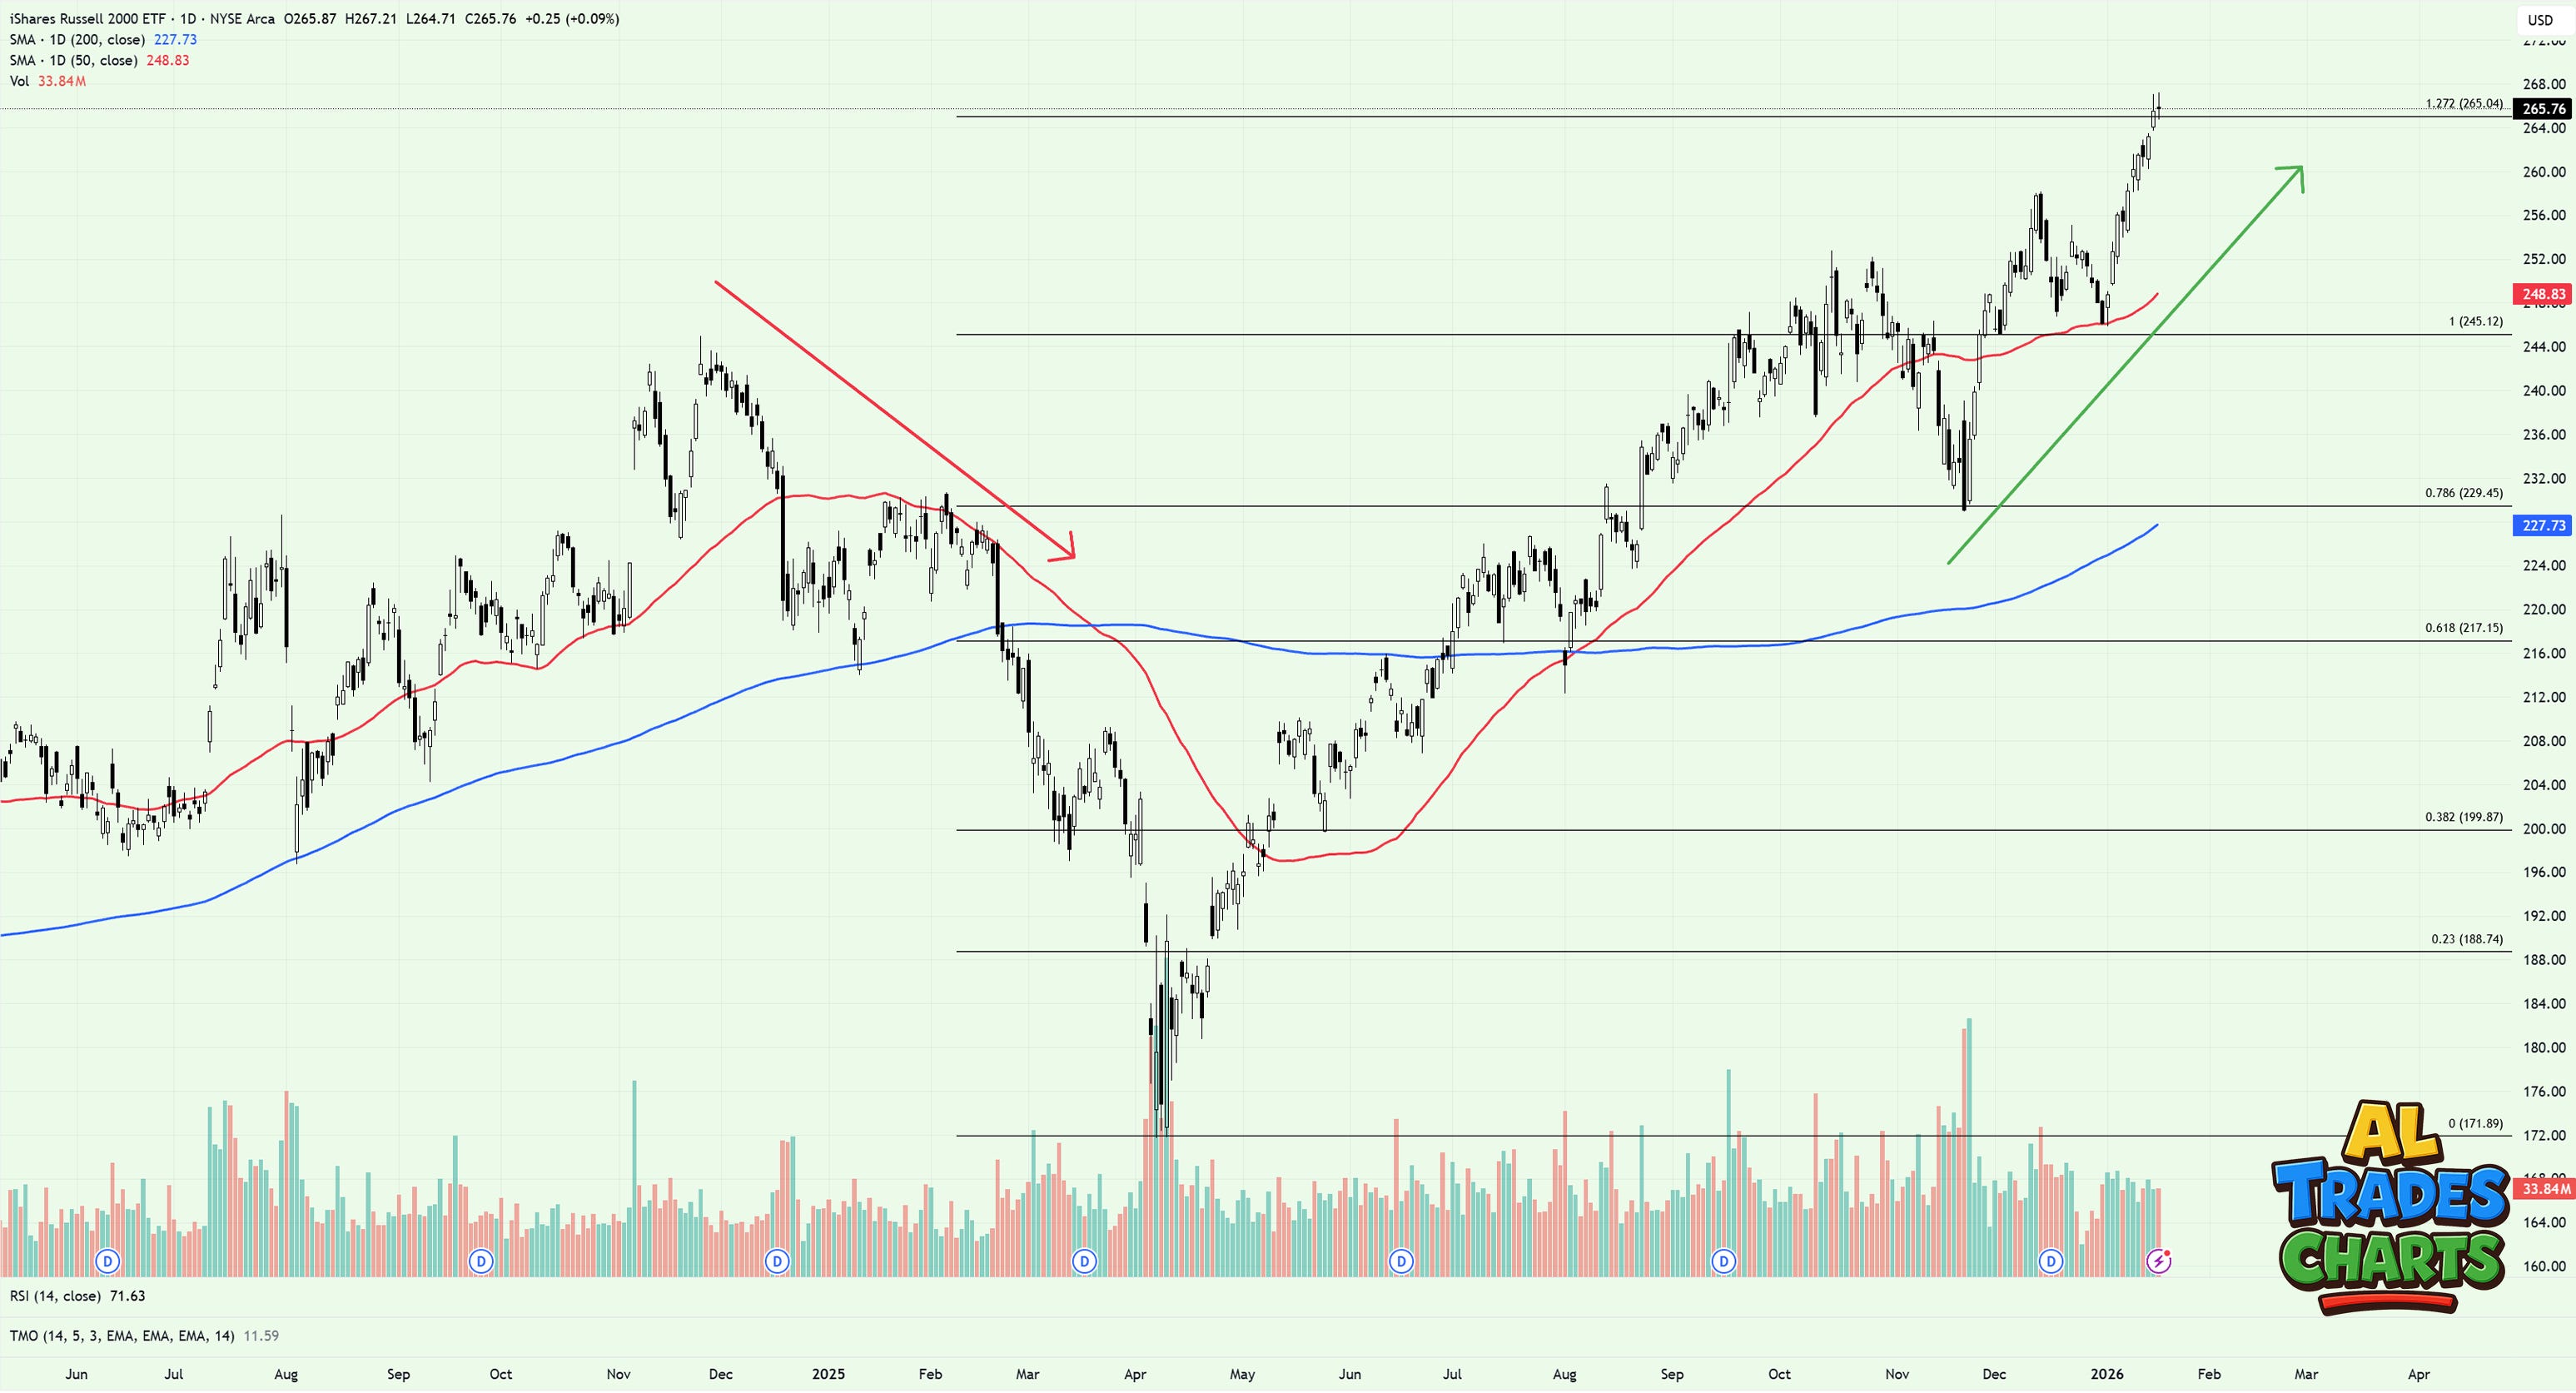
Outside of my ‘risk off’ indicators, IWM looks markedly different to the price action that played out in Q4/Q1 of last year and the period in which we’re trading today.
Note the surge to new ATHs in recent weeks compared to the clear breakdown that occurred prior to last year’s ‘tariff tantrum’.
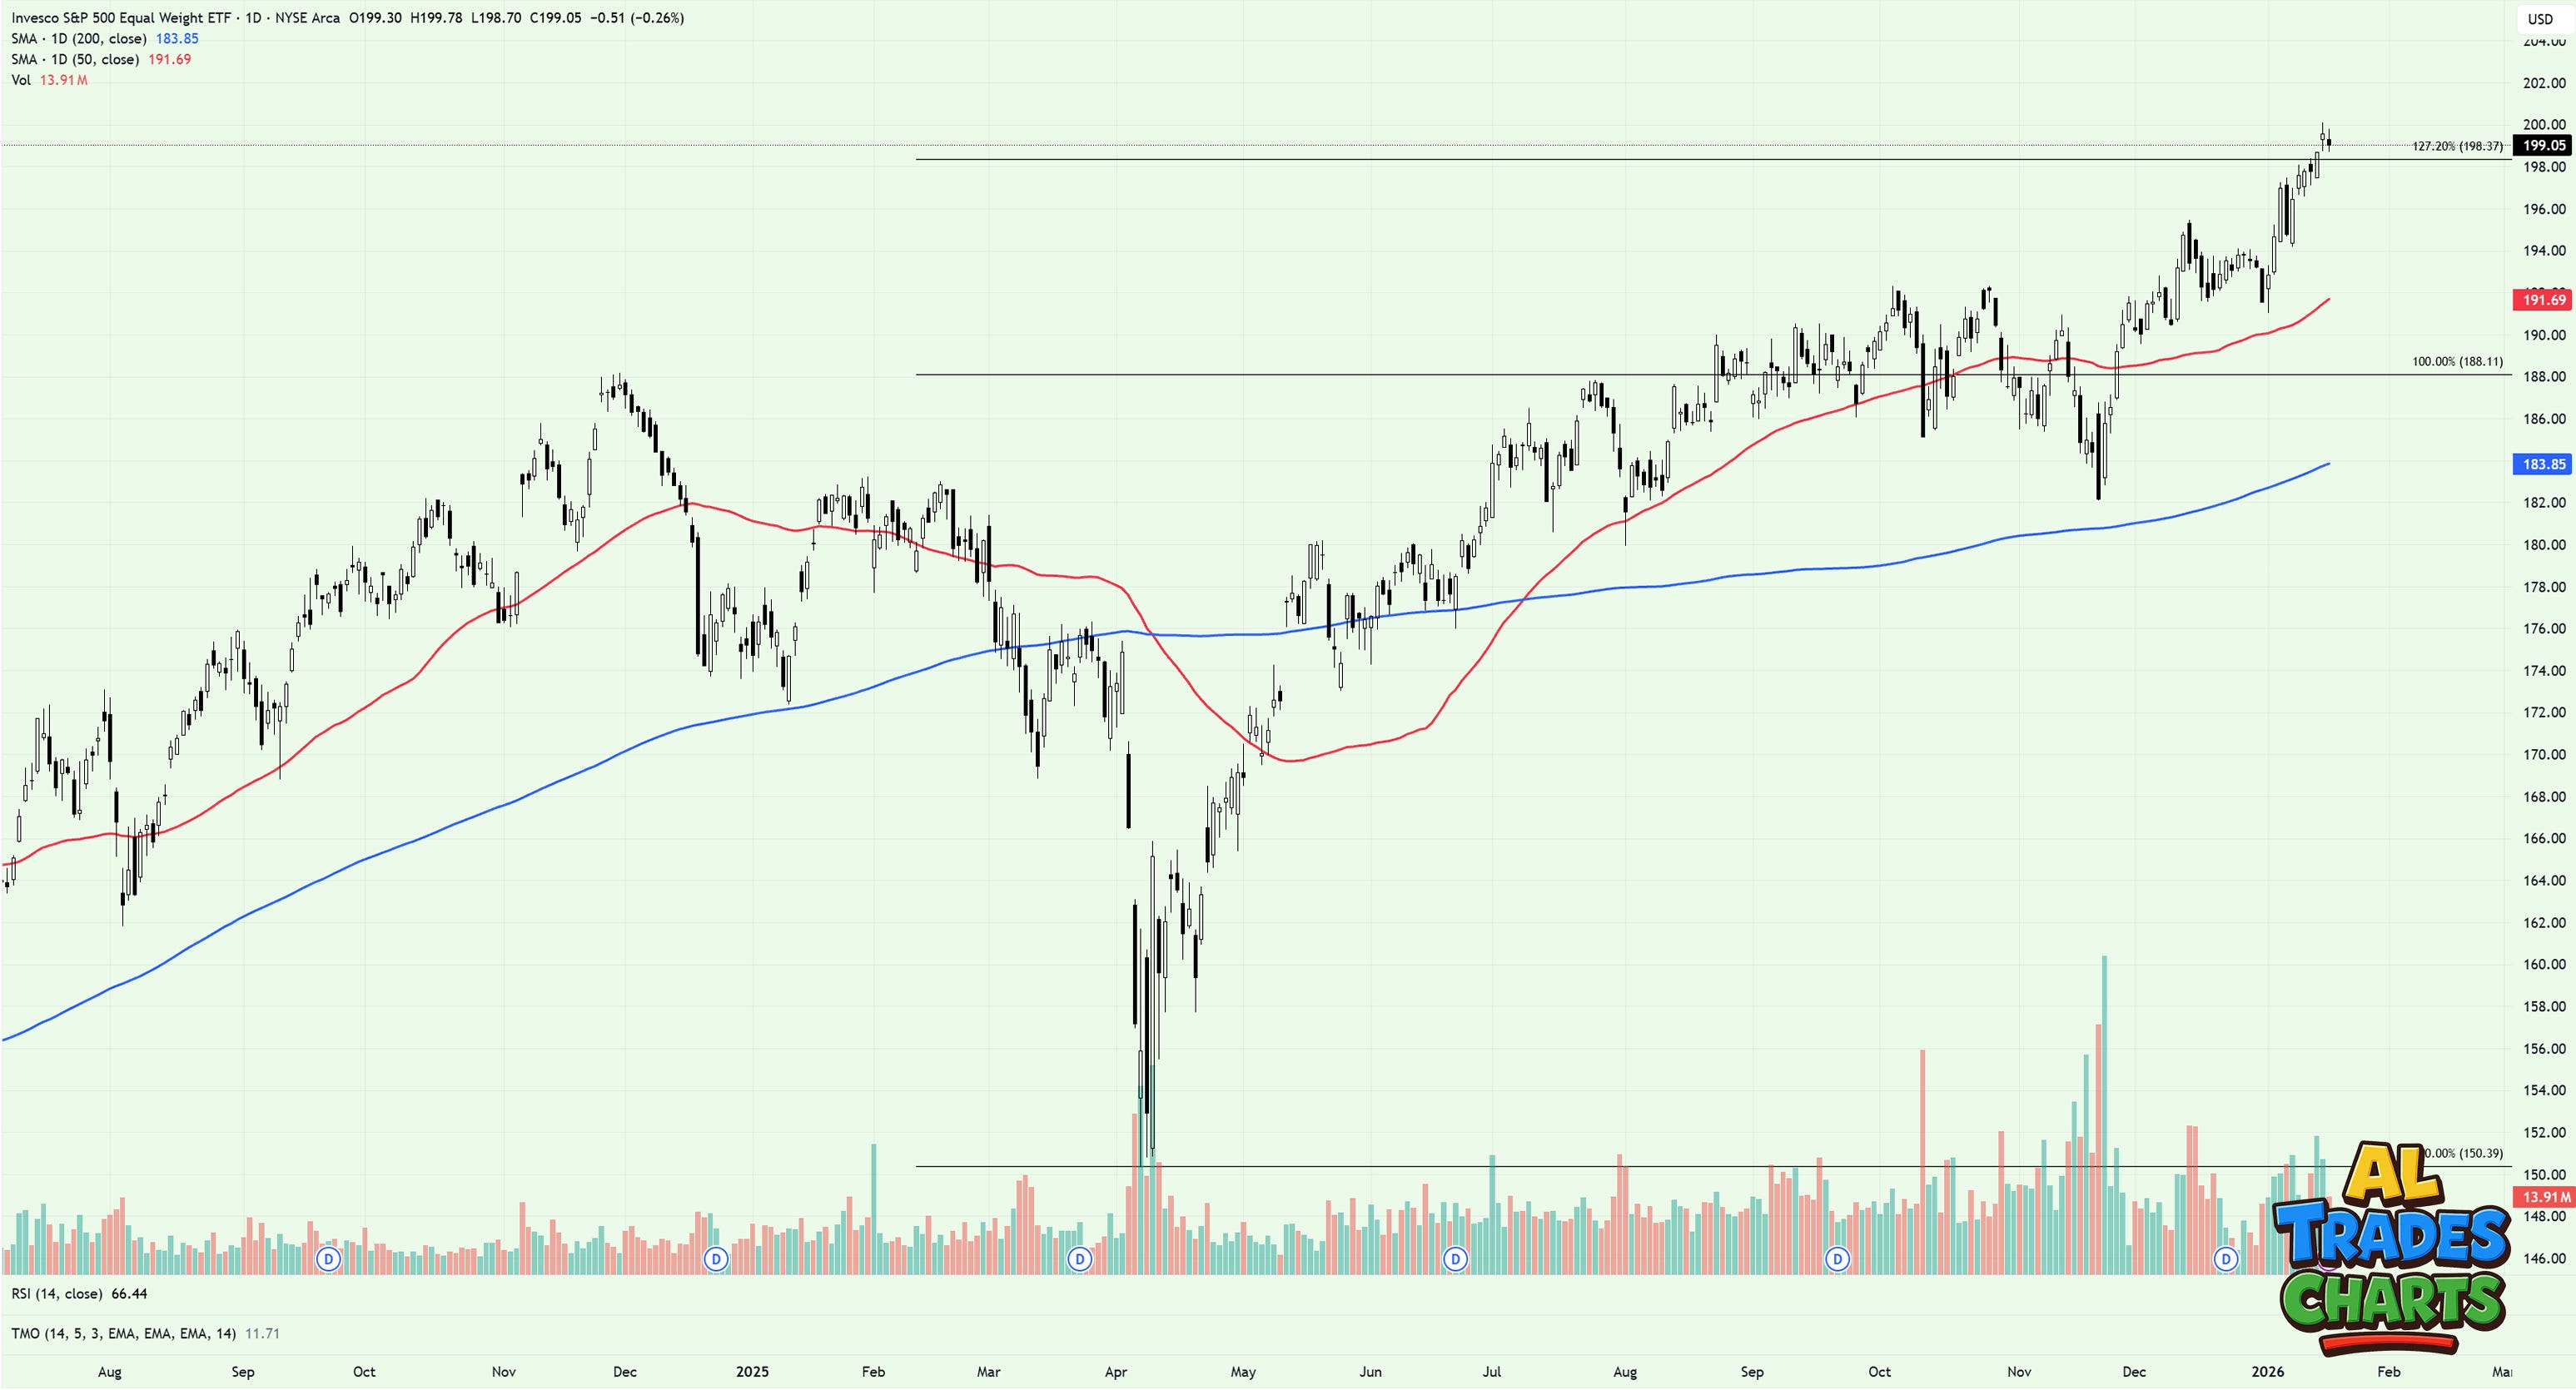
Equal weight S&P500 - same story.
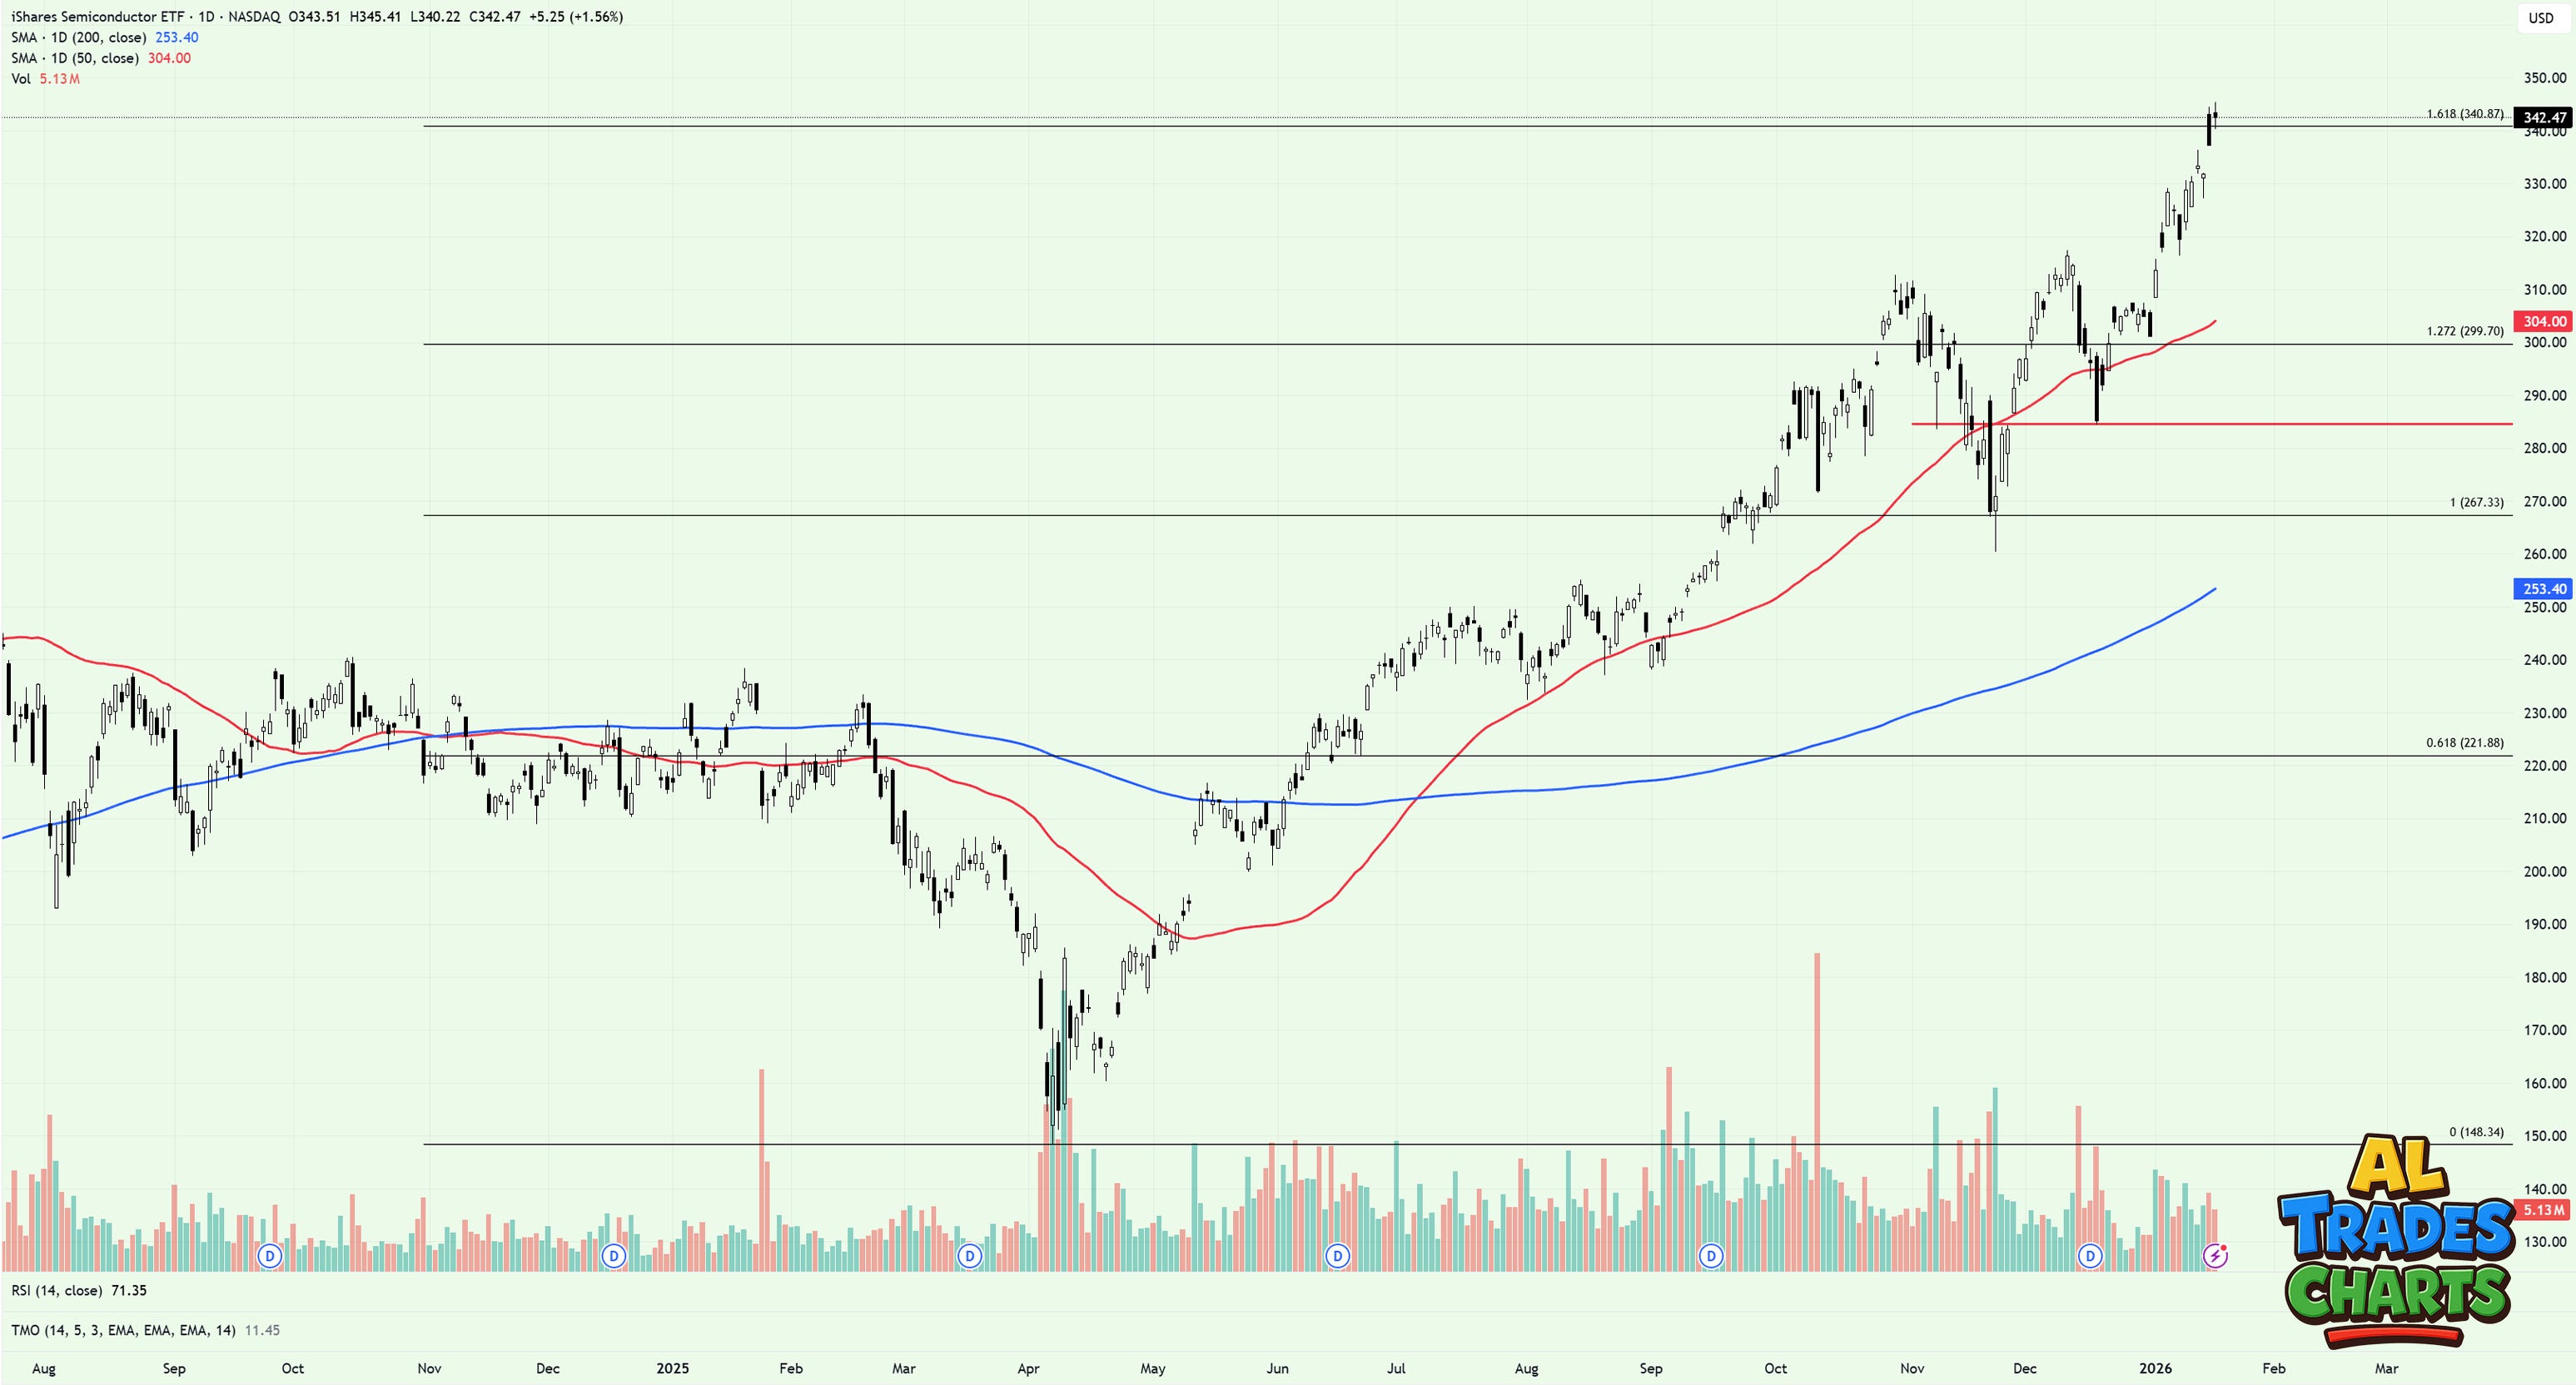
Semiconductors - same story.
So which road do we take?
At the crossroads in Cast Away, there’s no sign telling Chuck Noland which way to go — just four empty roads and the sense that standing still is no longer an option.
The bears have their signals. The bulls still have their structure. And the market, for now, is doing what it does best at moments like this — refusing to make anyone comfortable.
This is where process starts to matter more than prediction. Where indicators matter more than headlines. Where patience becomes a position in its own right, and restraint quietly outperforms conviction.
But patience doesn’t mean neutrality.
Right now, the primary trend is still pointing higher. Participation across areas like small caps, equal weight, and semiconductors continues to argue that this move hasn’t lost its footing just yet.
So my bias, for now, remains with the trend — not because I’m married to the upside, but because the market is still inviting it.
If that invitation gets withdrawn and my indicators start flashing red, I’ll respect it. But as long as the signal remains ‘risk on’, I’m going to carry on walking - seeing volatility spikes for what they have been since April of last year: opportunities.
Best,
Al