
Clean Air Doesn’t Mean Full Throttle
For now...at least

Whenever I think of the movie Drive, three things immediately spring to mind.
Ryan Gosling’s scorpion jacket
Carey Mulligan
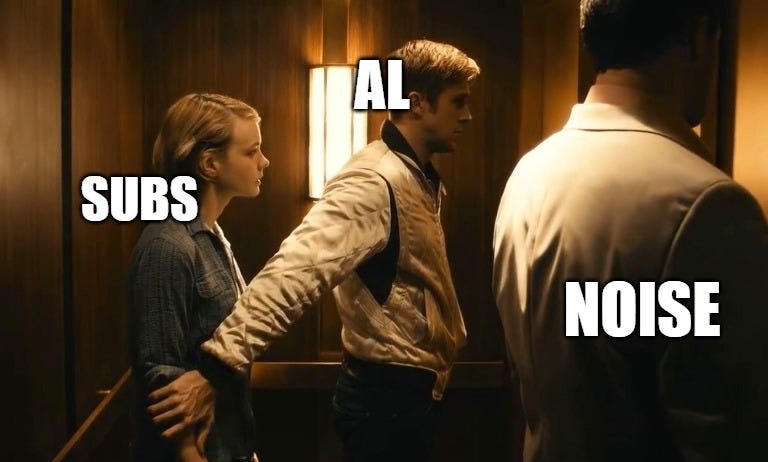
That elevator scene
Let’s revisit the latter - just in case you missed it.
Entering a lift, the driver (Ryan Gosling) realises a hitman has followed him and Irene (Carey Mulligan) inside. Pulling Irene behind him to protect her before sharing a quiet, slow motion kiss, the driver then turns towards the attacker, launching a violent assault before stomping his head in, leaving nothing more than a mangled face and bloodied corpse on the floor.
When the doors open, the driver doesn’t step out with Irene. He stands alone, knowing he is separate from the world outside.
Which is precisely how I’ve felt for the last few weeks…
Cashing in on Chaos
As has been the case for the best part of three weeks now, a significant number of traders still - somewhat shockingly - find themselves on the wrong side of the tape.
Fixated on oil and the Middle East, said traders remain sidelined by a market that simply refuses to let them in. Every day they speak of a dip that’s yet to come - and if that fails, they don’t hesitate in turning to the old adage of ‘MaNiPuLaTiOn’ to justify their poor decision making in what has been a hugely profitable couple of weeks.
For those of you that opted to join the paid tier of Al Trades Charts, congratulations.
If you only took one contract per trade in the live chat, my math shows you’ll be up a not-too-shabby $3,714 on closed trades. Not bad for a month’s work.
Risk-On Remains In-Play
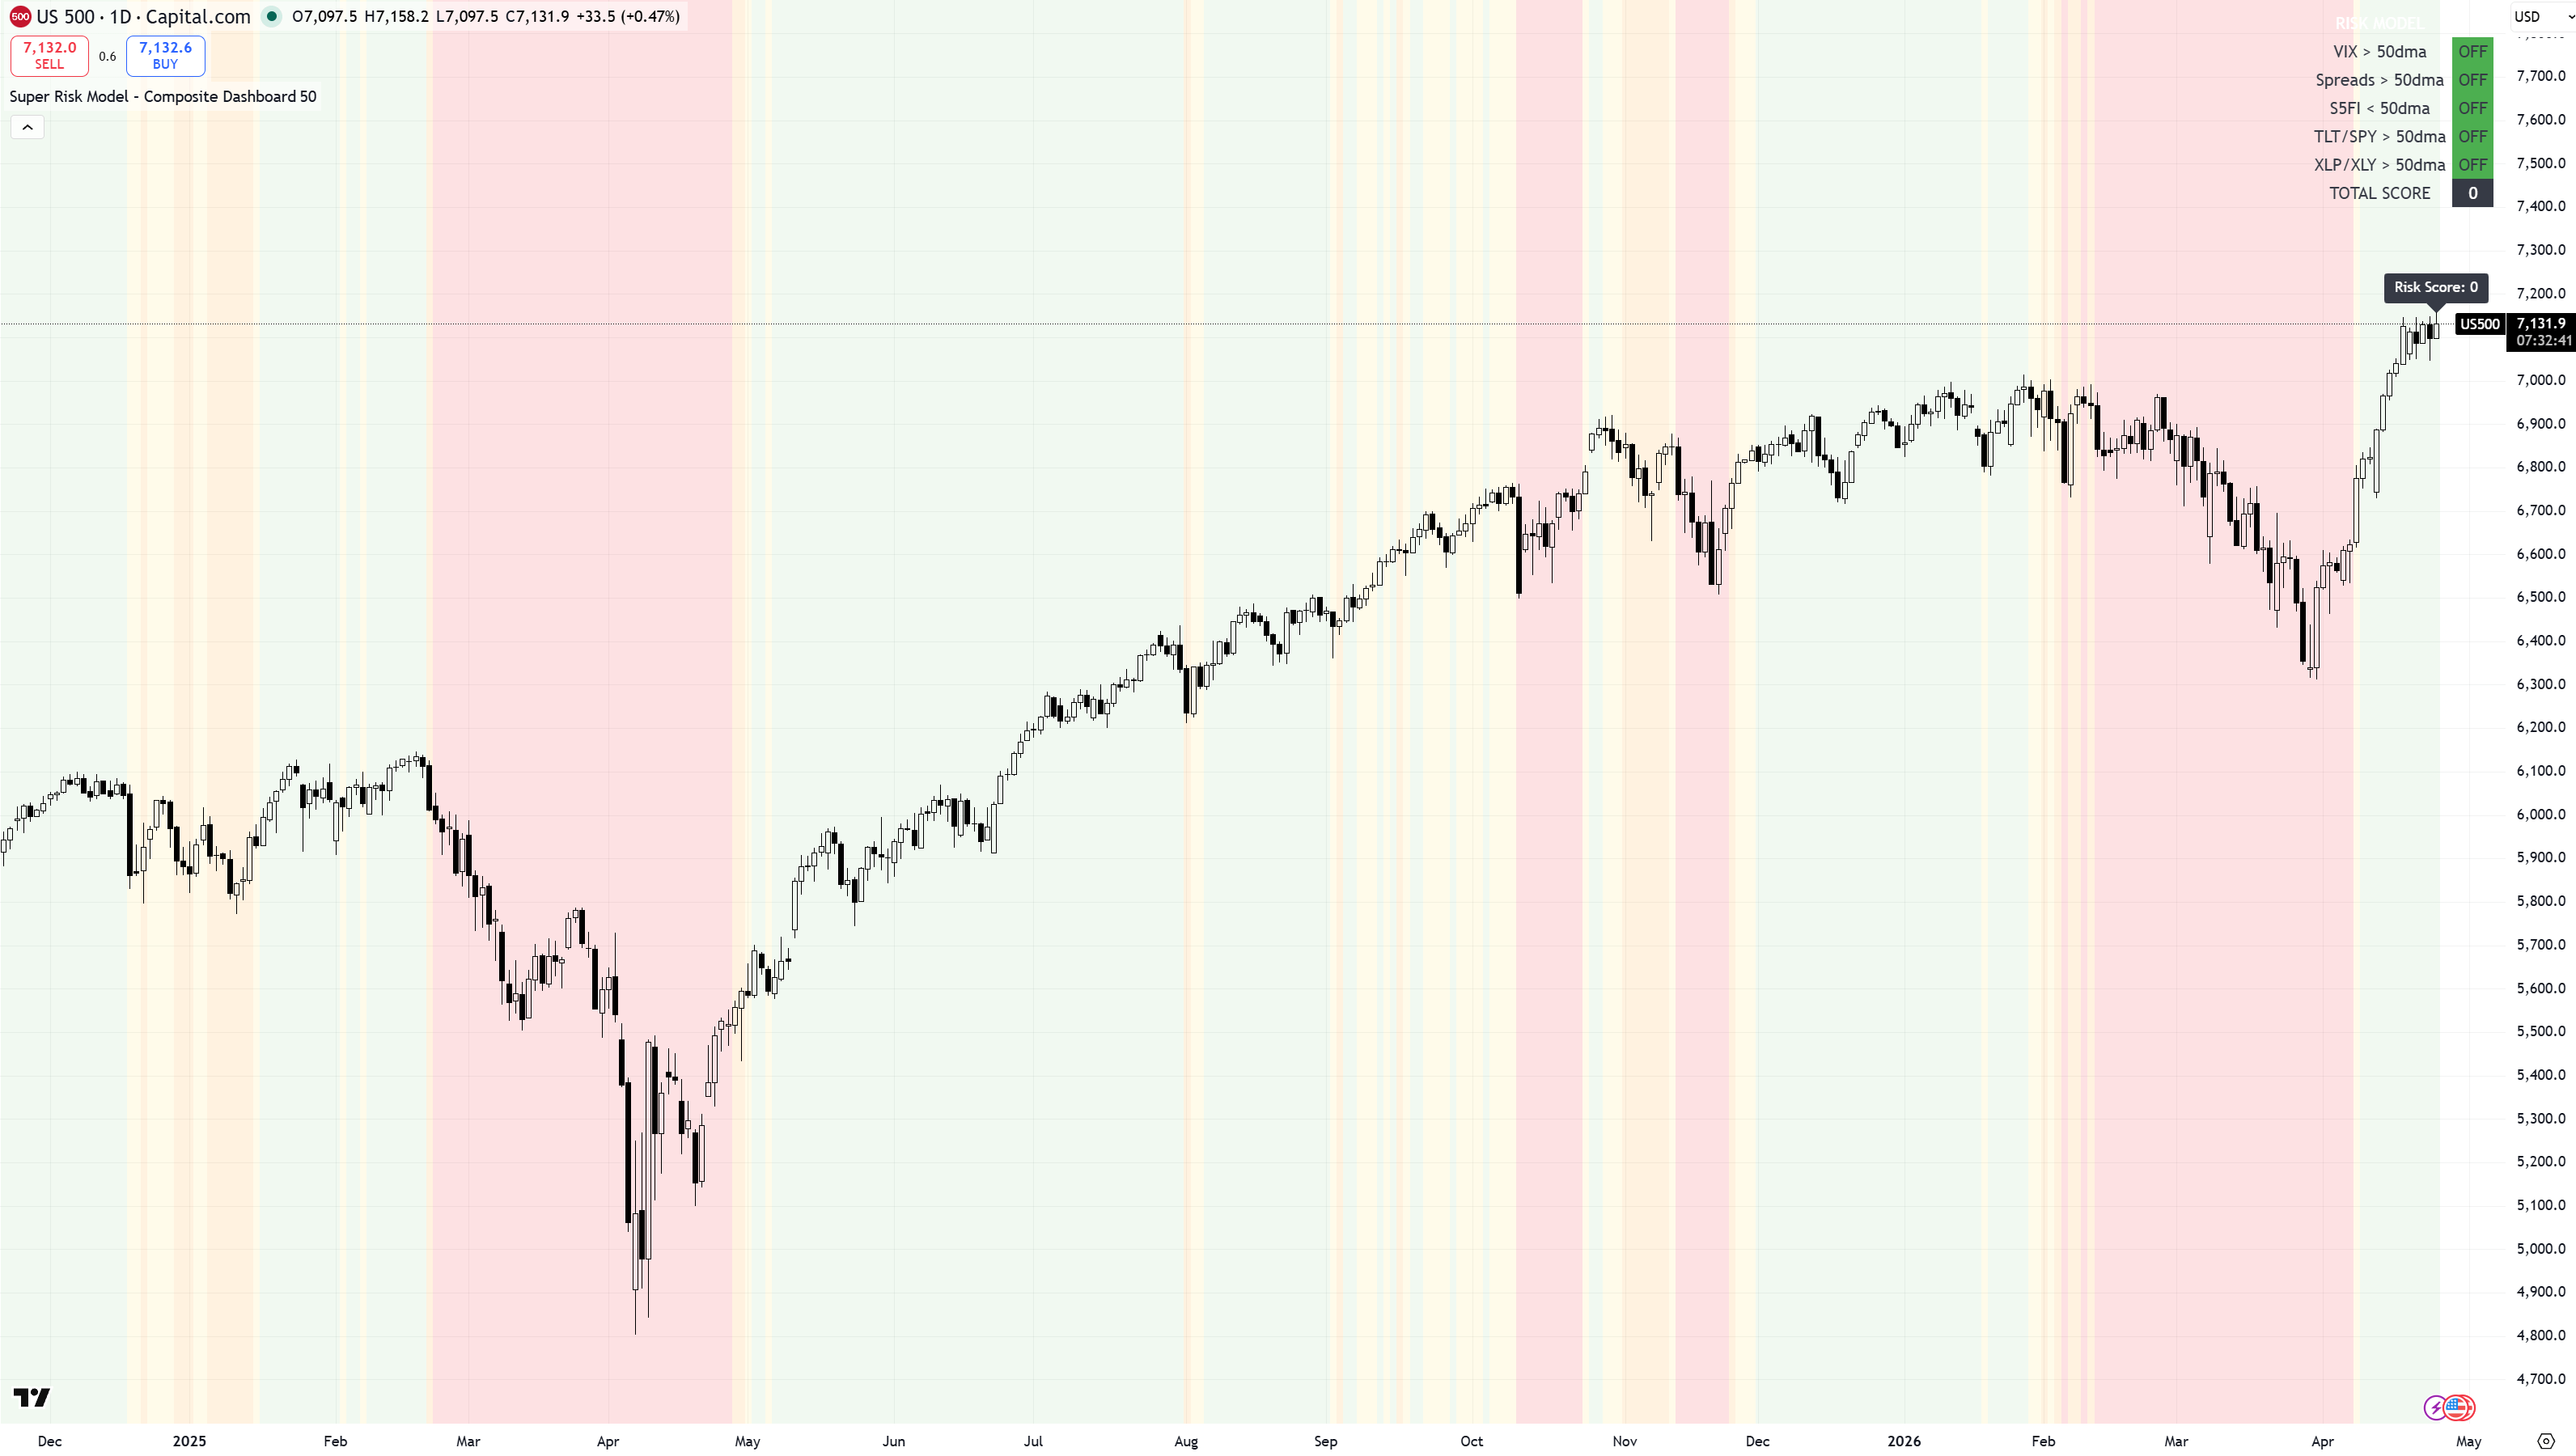
Rather than switching between Risk Models 1 and 2 in each post, I decided the most efficient route would be to build a composite of both models on one clean chart.
And what does that chart show at the time of writing? Clean air.
What you’re looking at here is a composite model blending five signals that historically shift when markets transition from healthy trend conditions into fragile environments:
VIX vs its 50-day average → volatility pressure rising or easing
Credit spreads (BAMLHY) vs 50-day average → stress in corporate debt
% of S&P 500 stocks above their 50-day average → internal market participation
TLT/SPY ratio vs 50-day average → defensive positioning vs growth exposure
XLP/XLY ratio vs 50-day average → staples outperforming discretionary (risk-off behavior)
When these start flipping either unison or isolation, it typically signals a shift in market tone. To help make it clear what kind of regime we’re in at any given moment, I simply applied a color-coded overlay to the chart:
🟢 Aligned risk-on → dips are usually buyable (present setup)
🟡 Mixed regime → selective exposure only, trade with relative strength
🔴 Aligned risk-off → capital preservation matters more than conviction
As you can see on the chart we are currently in the ‘green zone’ - signaling that dip buying remains the dominant strategy - something that should theoretically continue so long as SPY and QQQ trade in positive gamma.
Should this change, all subs will be notified. But until it does, I’m looking at areas of the market which continue to lead - and those which may just be emerging.
Pick Your Winners
Not all areas of the market trade the same relative to the regime that’s in play. Just because we’re in clean air doesn’t mean something like MSTR is automatically destined for new ATHs, for example. I think this is a common misconception - so it’s worth remembering.
One of the easiest ways to stay aligned with what’s actually working is by tracking relative strength using data.
To help do this, I typically start by comparing sector ETFs relative to the broader index (SPY) on a weekly chart, overlaid with a simple 10/21wma ribbon to help visualize the trend that’s in-play. If that proves too janky, I switch it up to the 21/50wma combination instead. Pretty simple stuff.
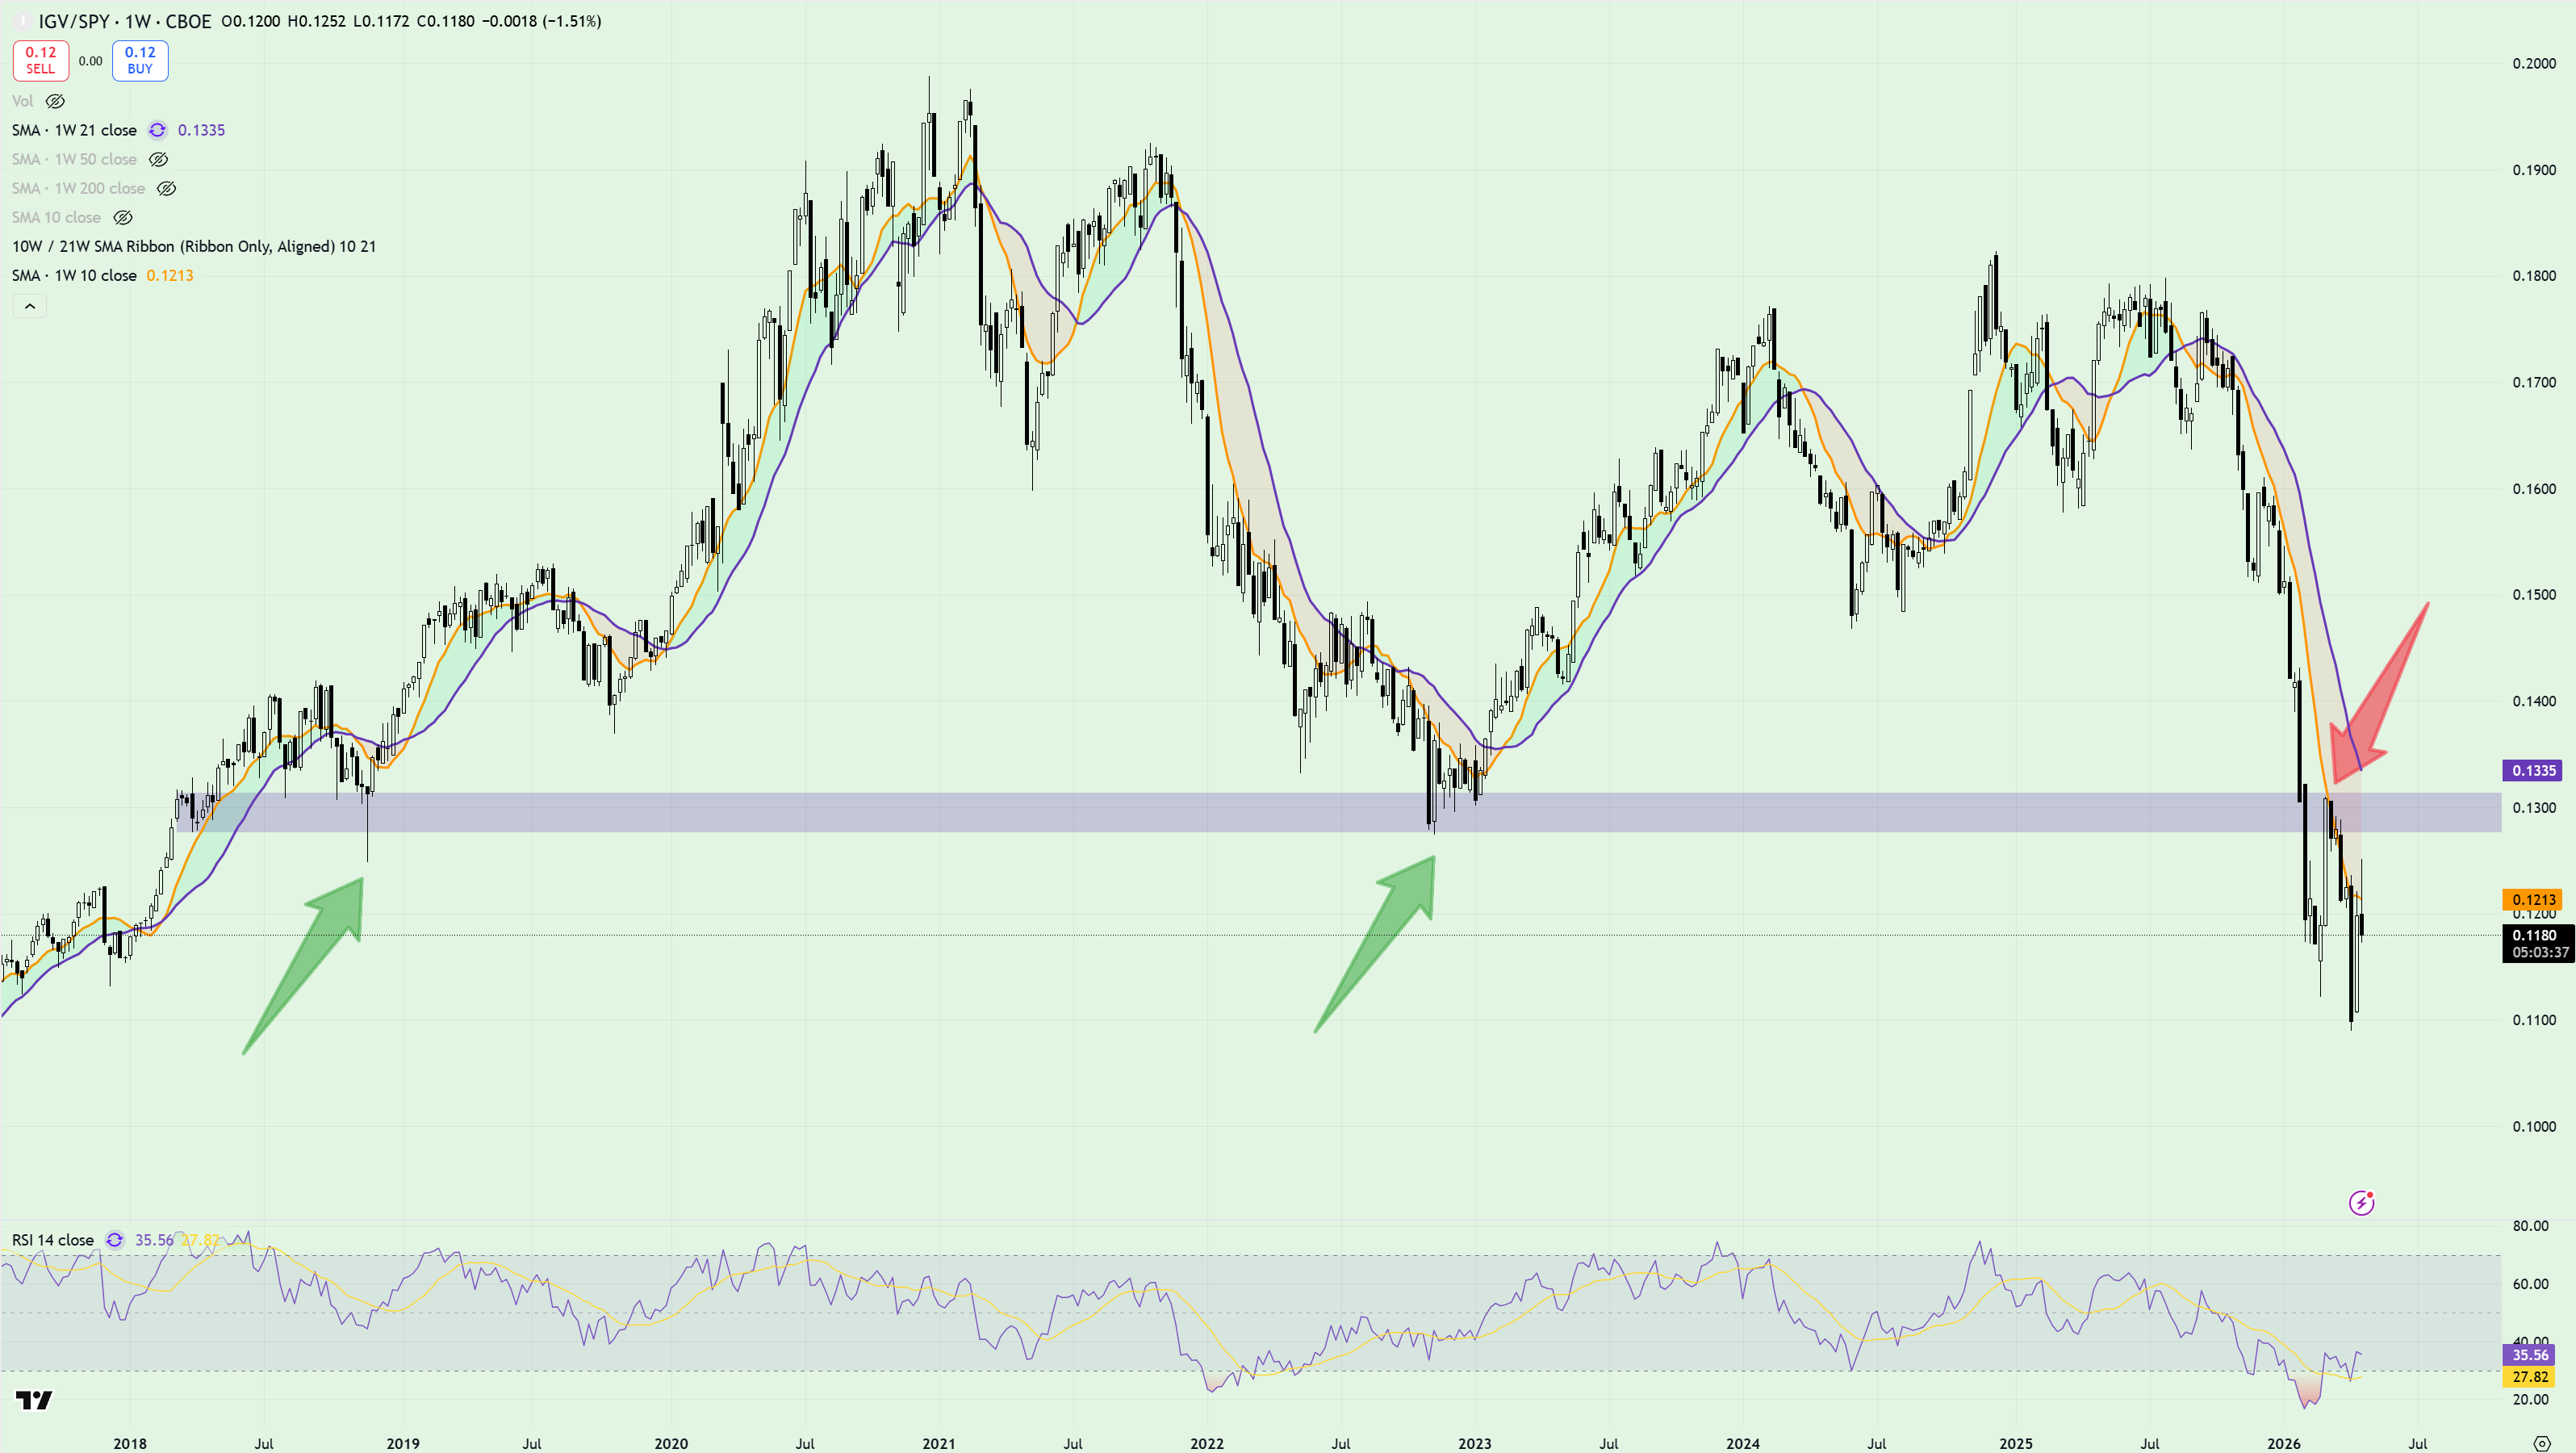
Here’s a great example - IGV/SPY.
What’s noticeable here is that despite the market flipping from ‘risk off’ to ‘risk on’ - software still looks like hot trash - trading below a rapidly declining 10/21wma ribbon having flipped prior support into resistance.
Whereas semiconductors, on the other hand…
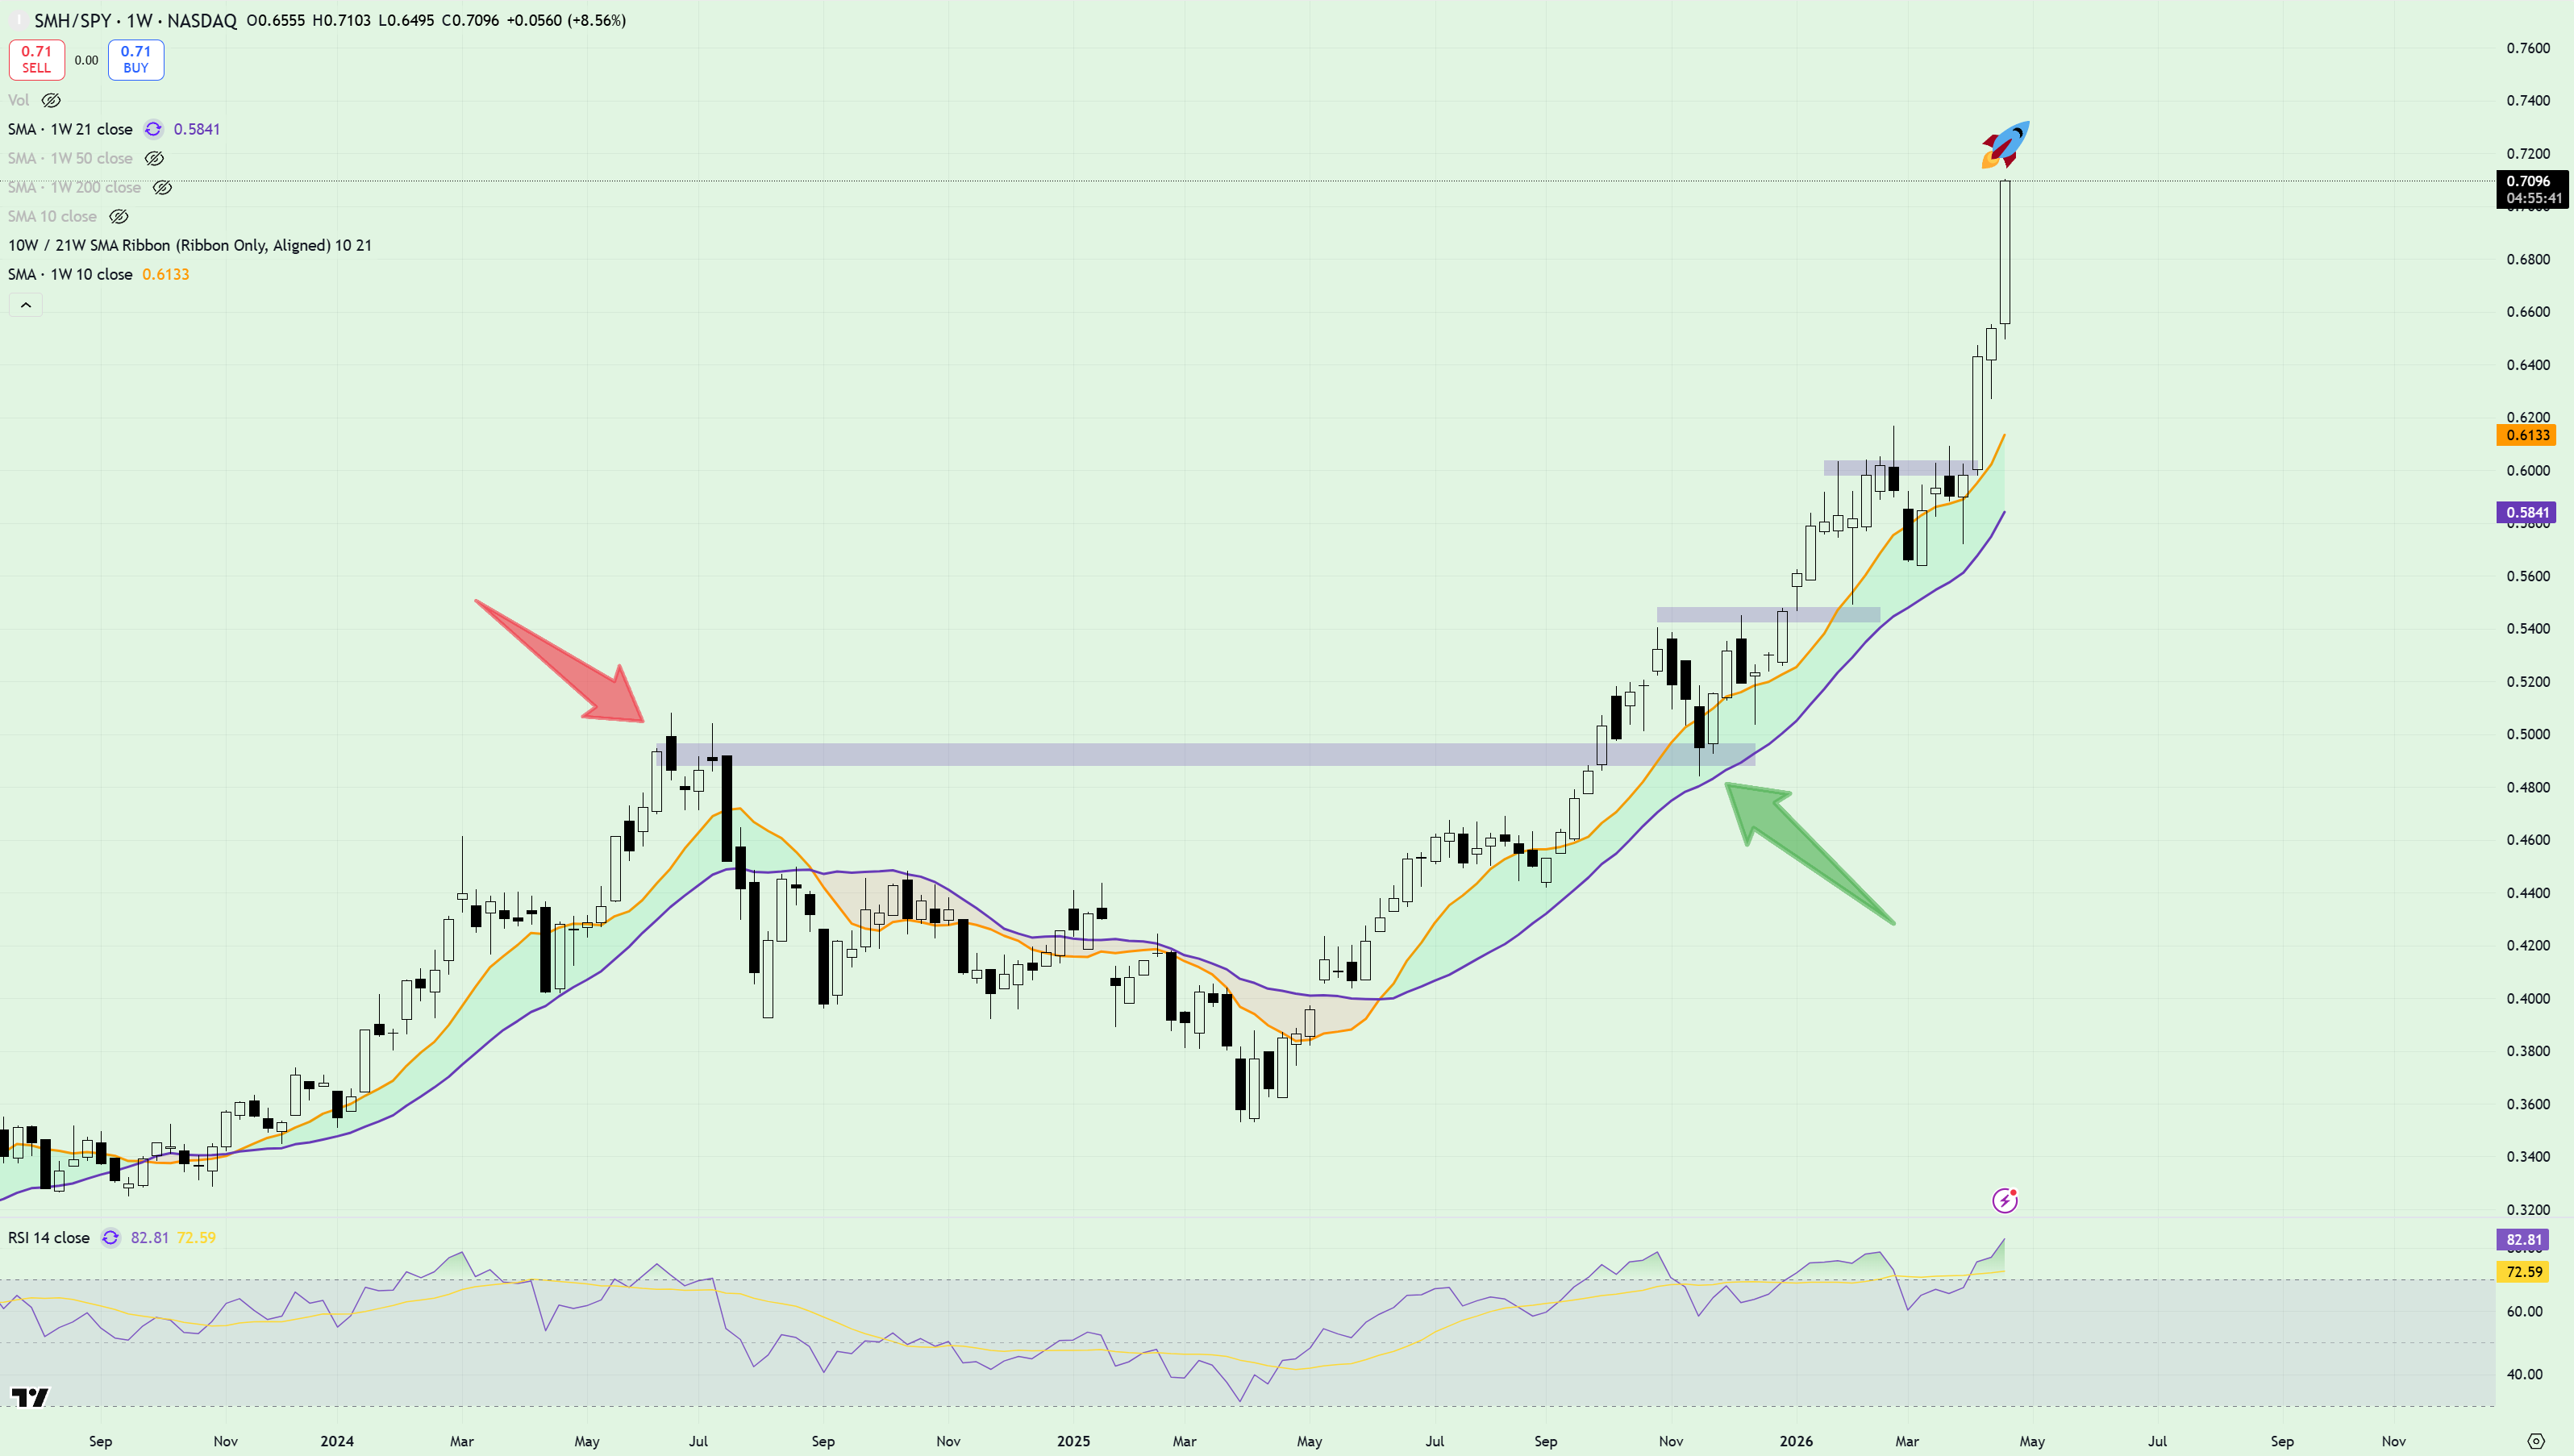
Upwardly mobile, stretching wayyyy above the inclining 10/21wma ribbon, smashing through prior resistance and flipping it to support. Pure, unadulterated leadership.
So What’s Next?
If you caught the generational run in semis, great work. Subs were alerted a few weeks ago that I was buying INTC which turned out to be an awesome trade. AEHR was another that worked well, climbing from $42 to $90+.
But with semis looking overextended and overbought, my attention is turning to areas of the market that are showing renewed, or existing strength, relative to the wider market.
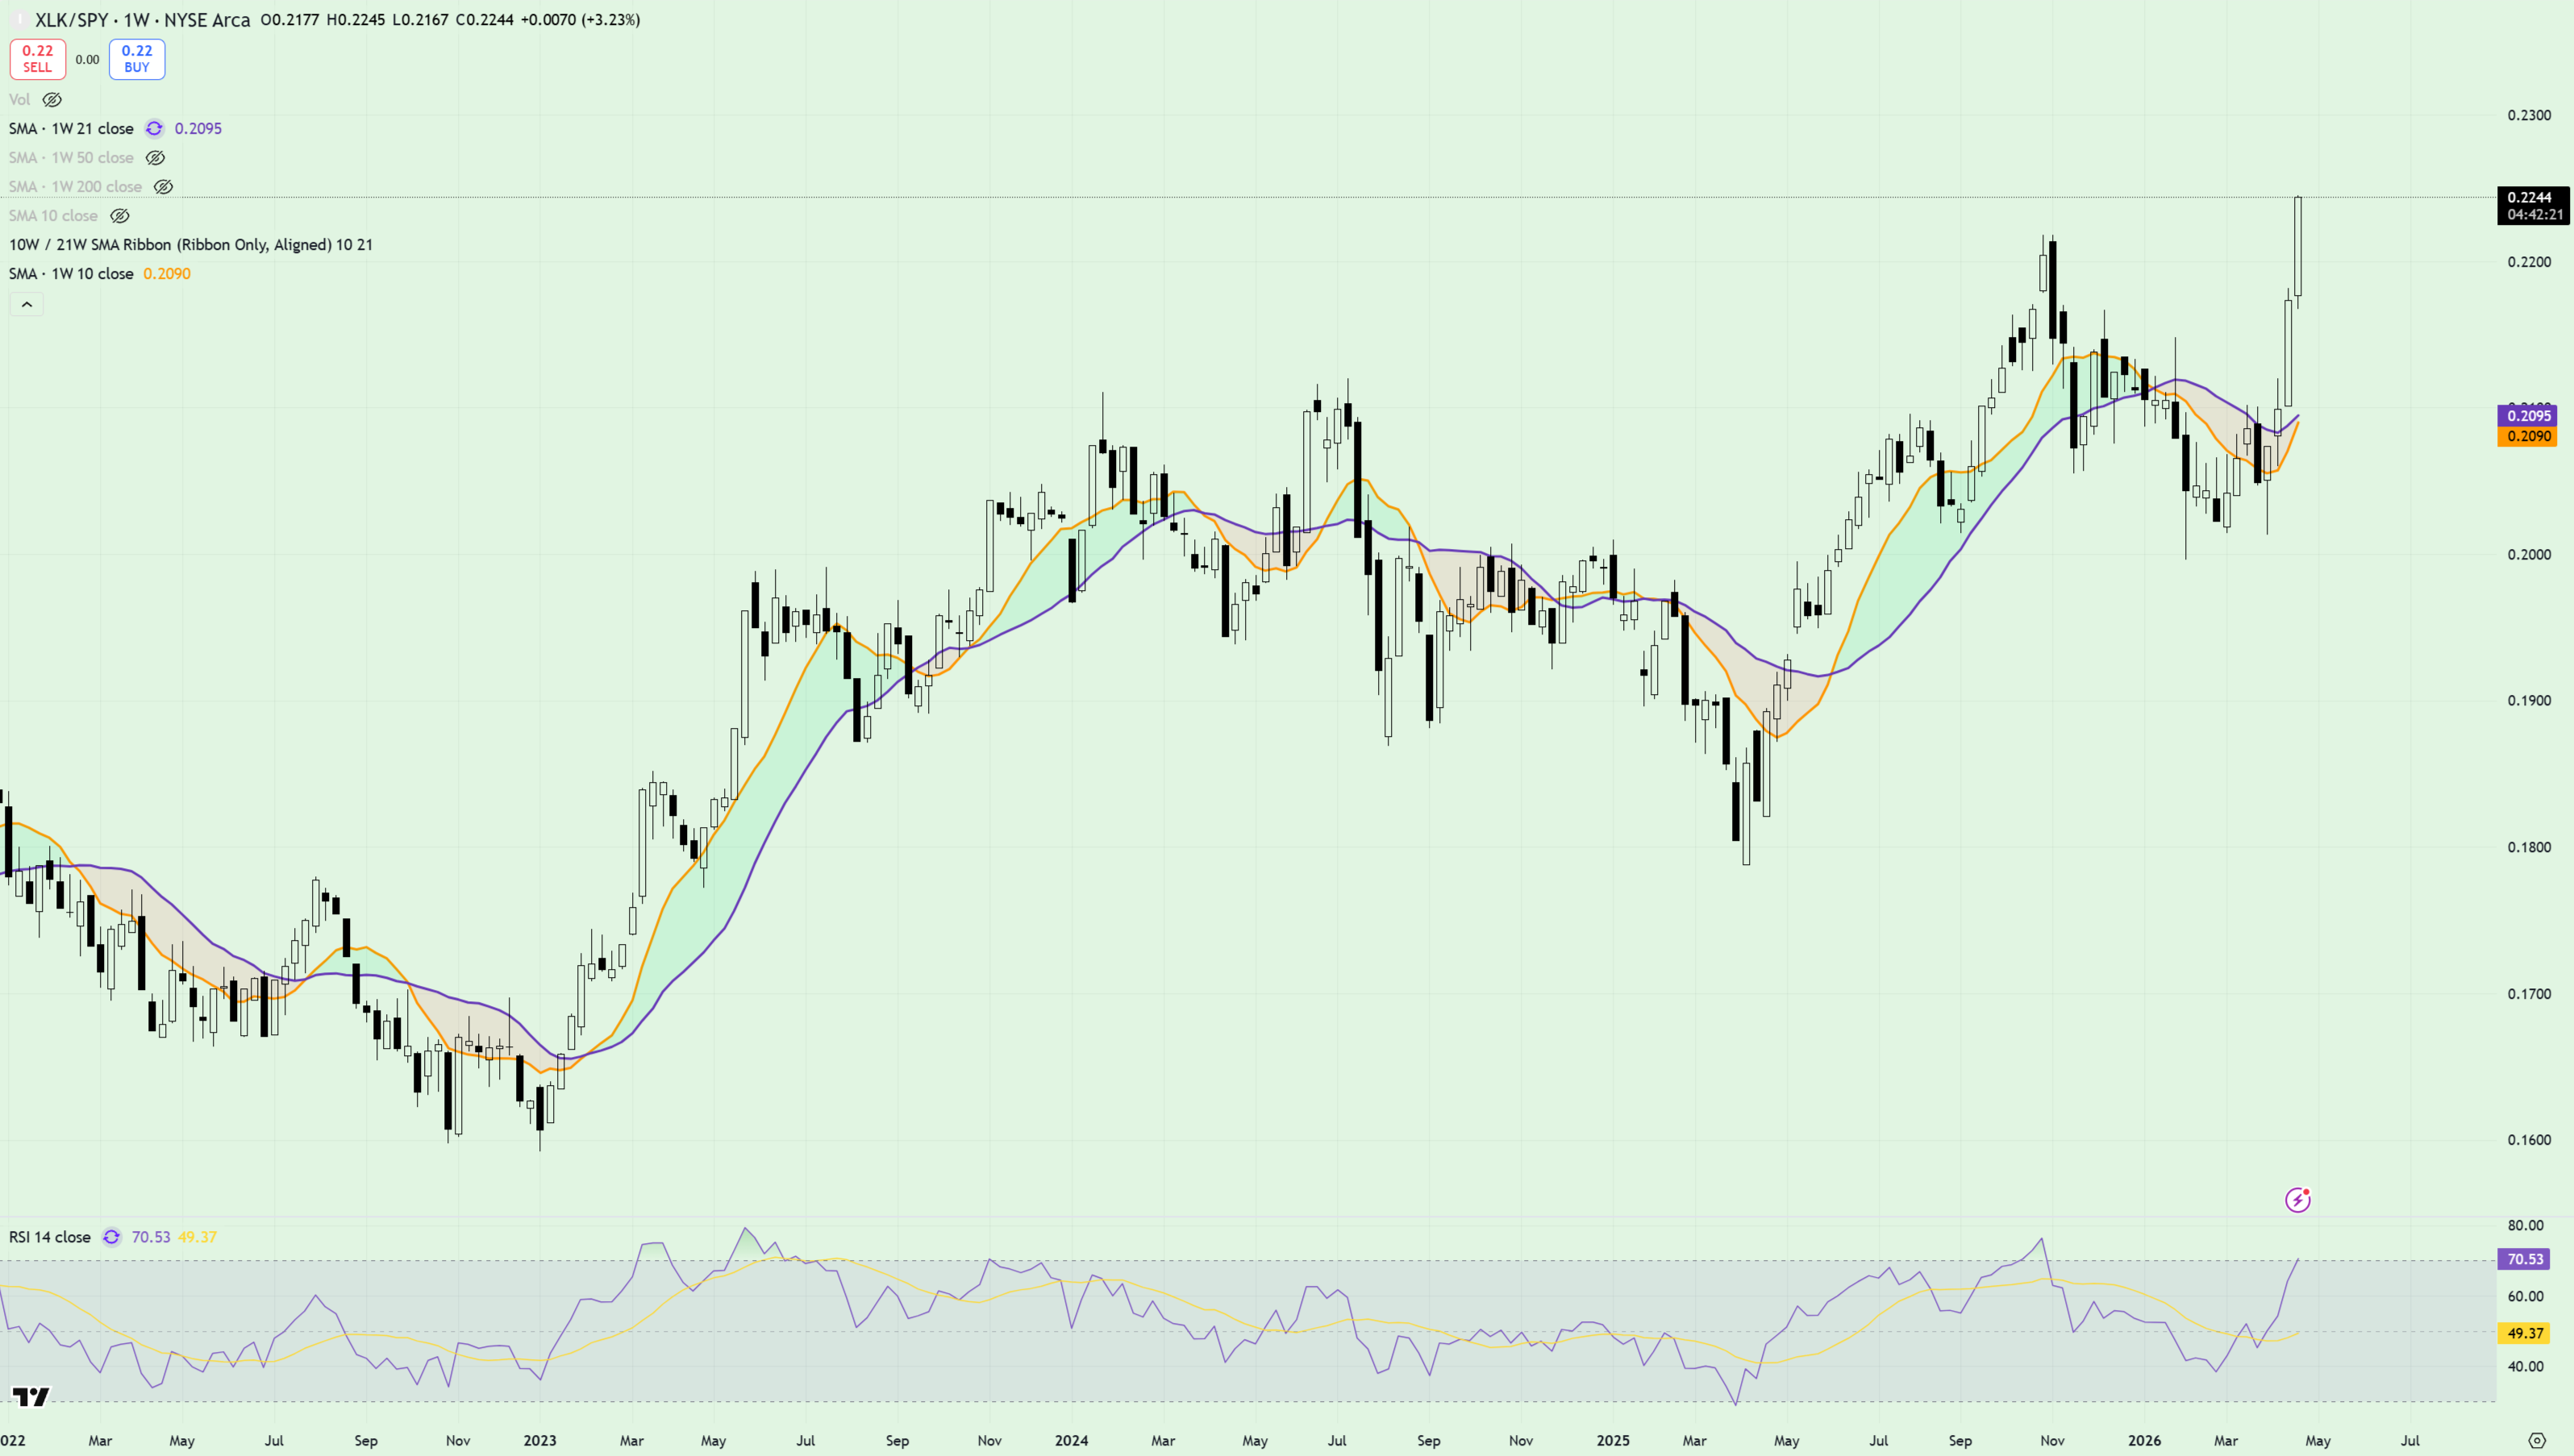
If we’re staying true to the parameters detailed above, the natural place to start is tech - XLK/SPY - the thing that’s been leading the bull market since its inception in 2022. The only thing that’s concerning me here is the RSI - which is nearing the overbought zone on the weekly chart - something which has typically preceded corrective moves.
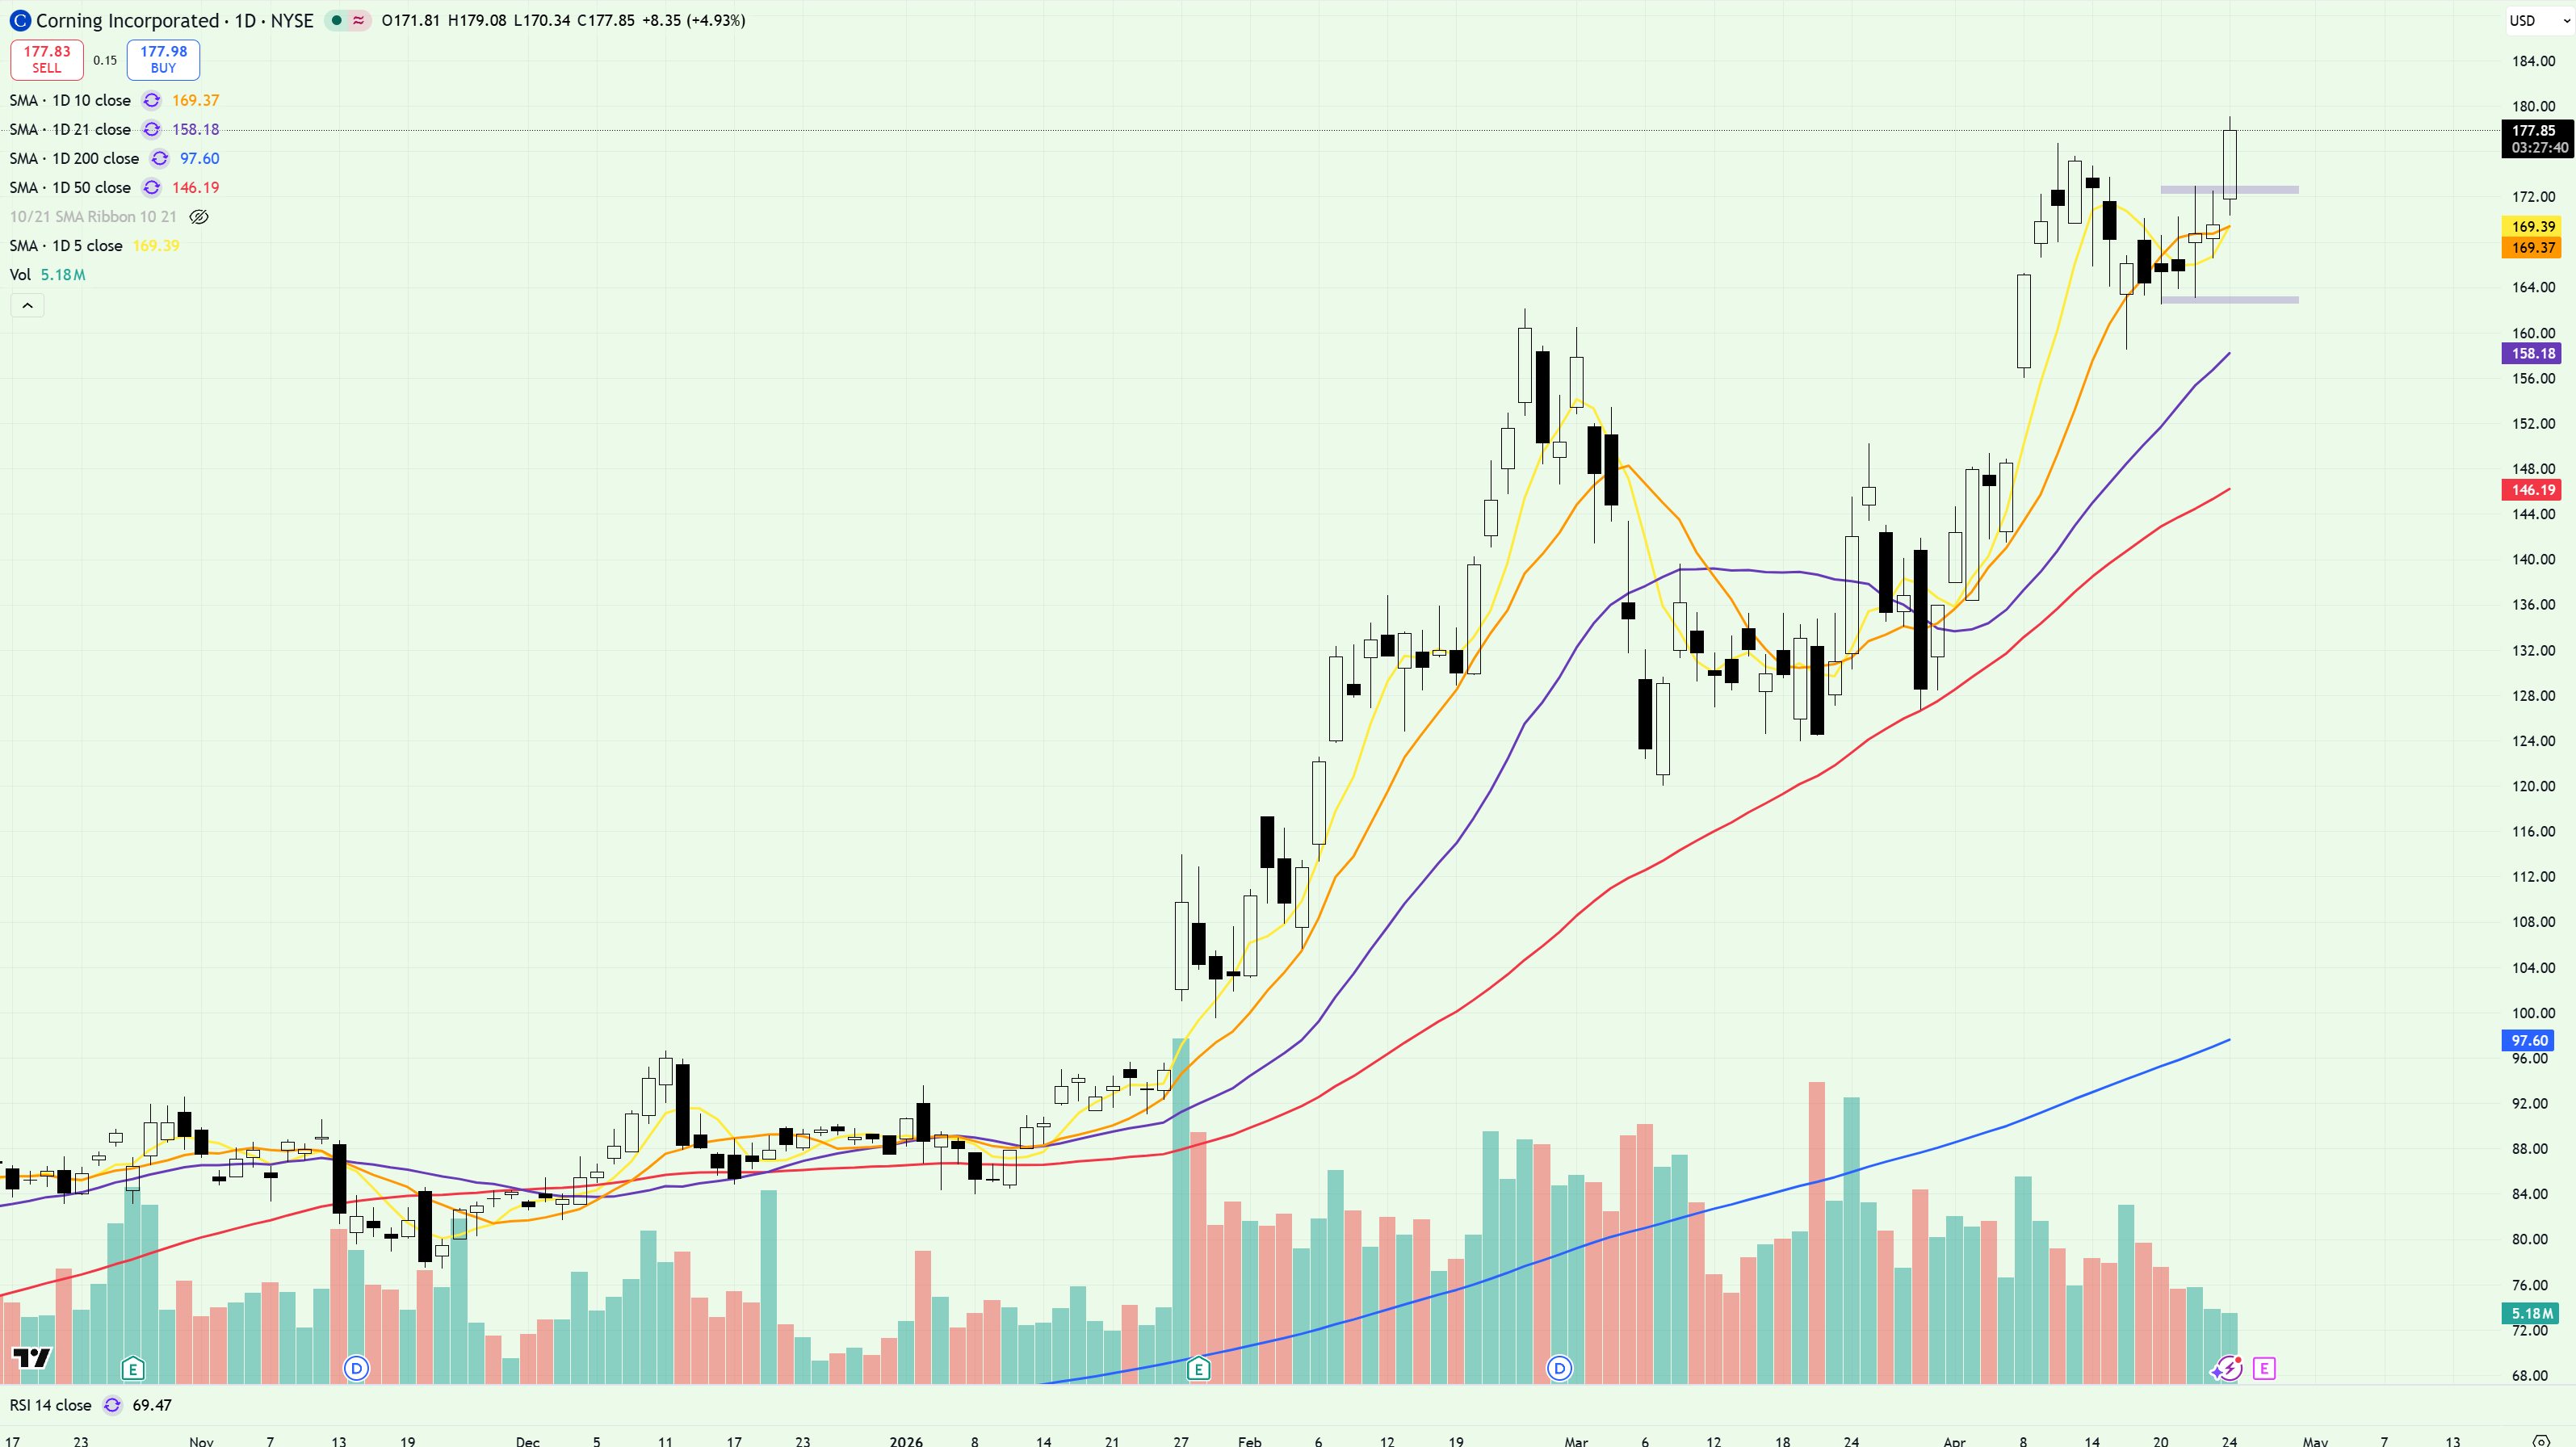
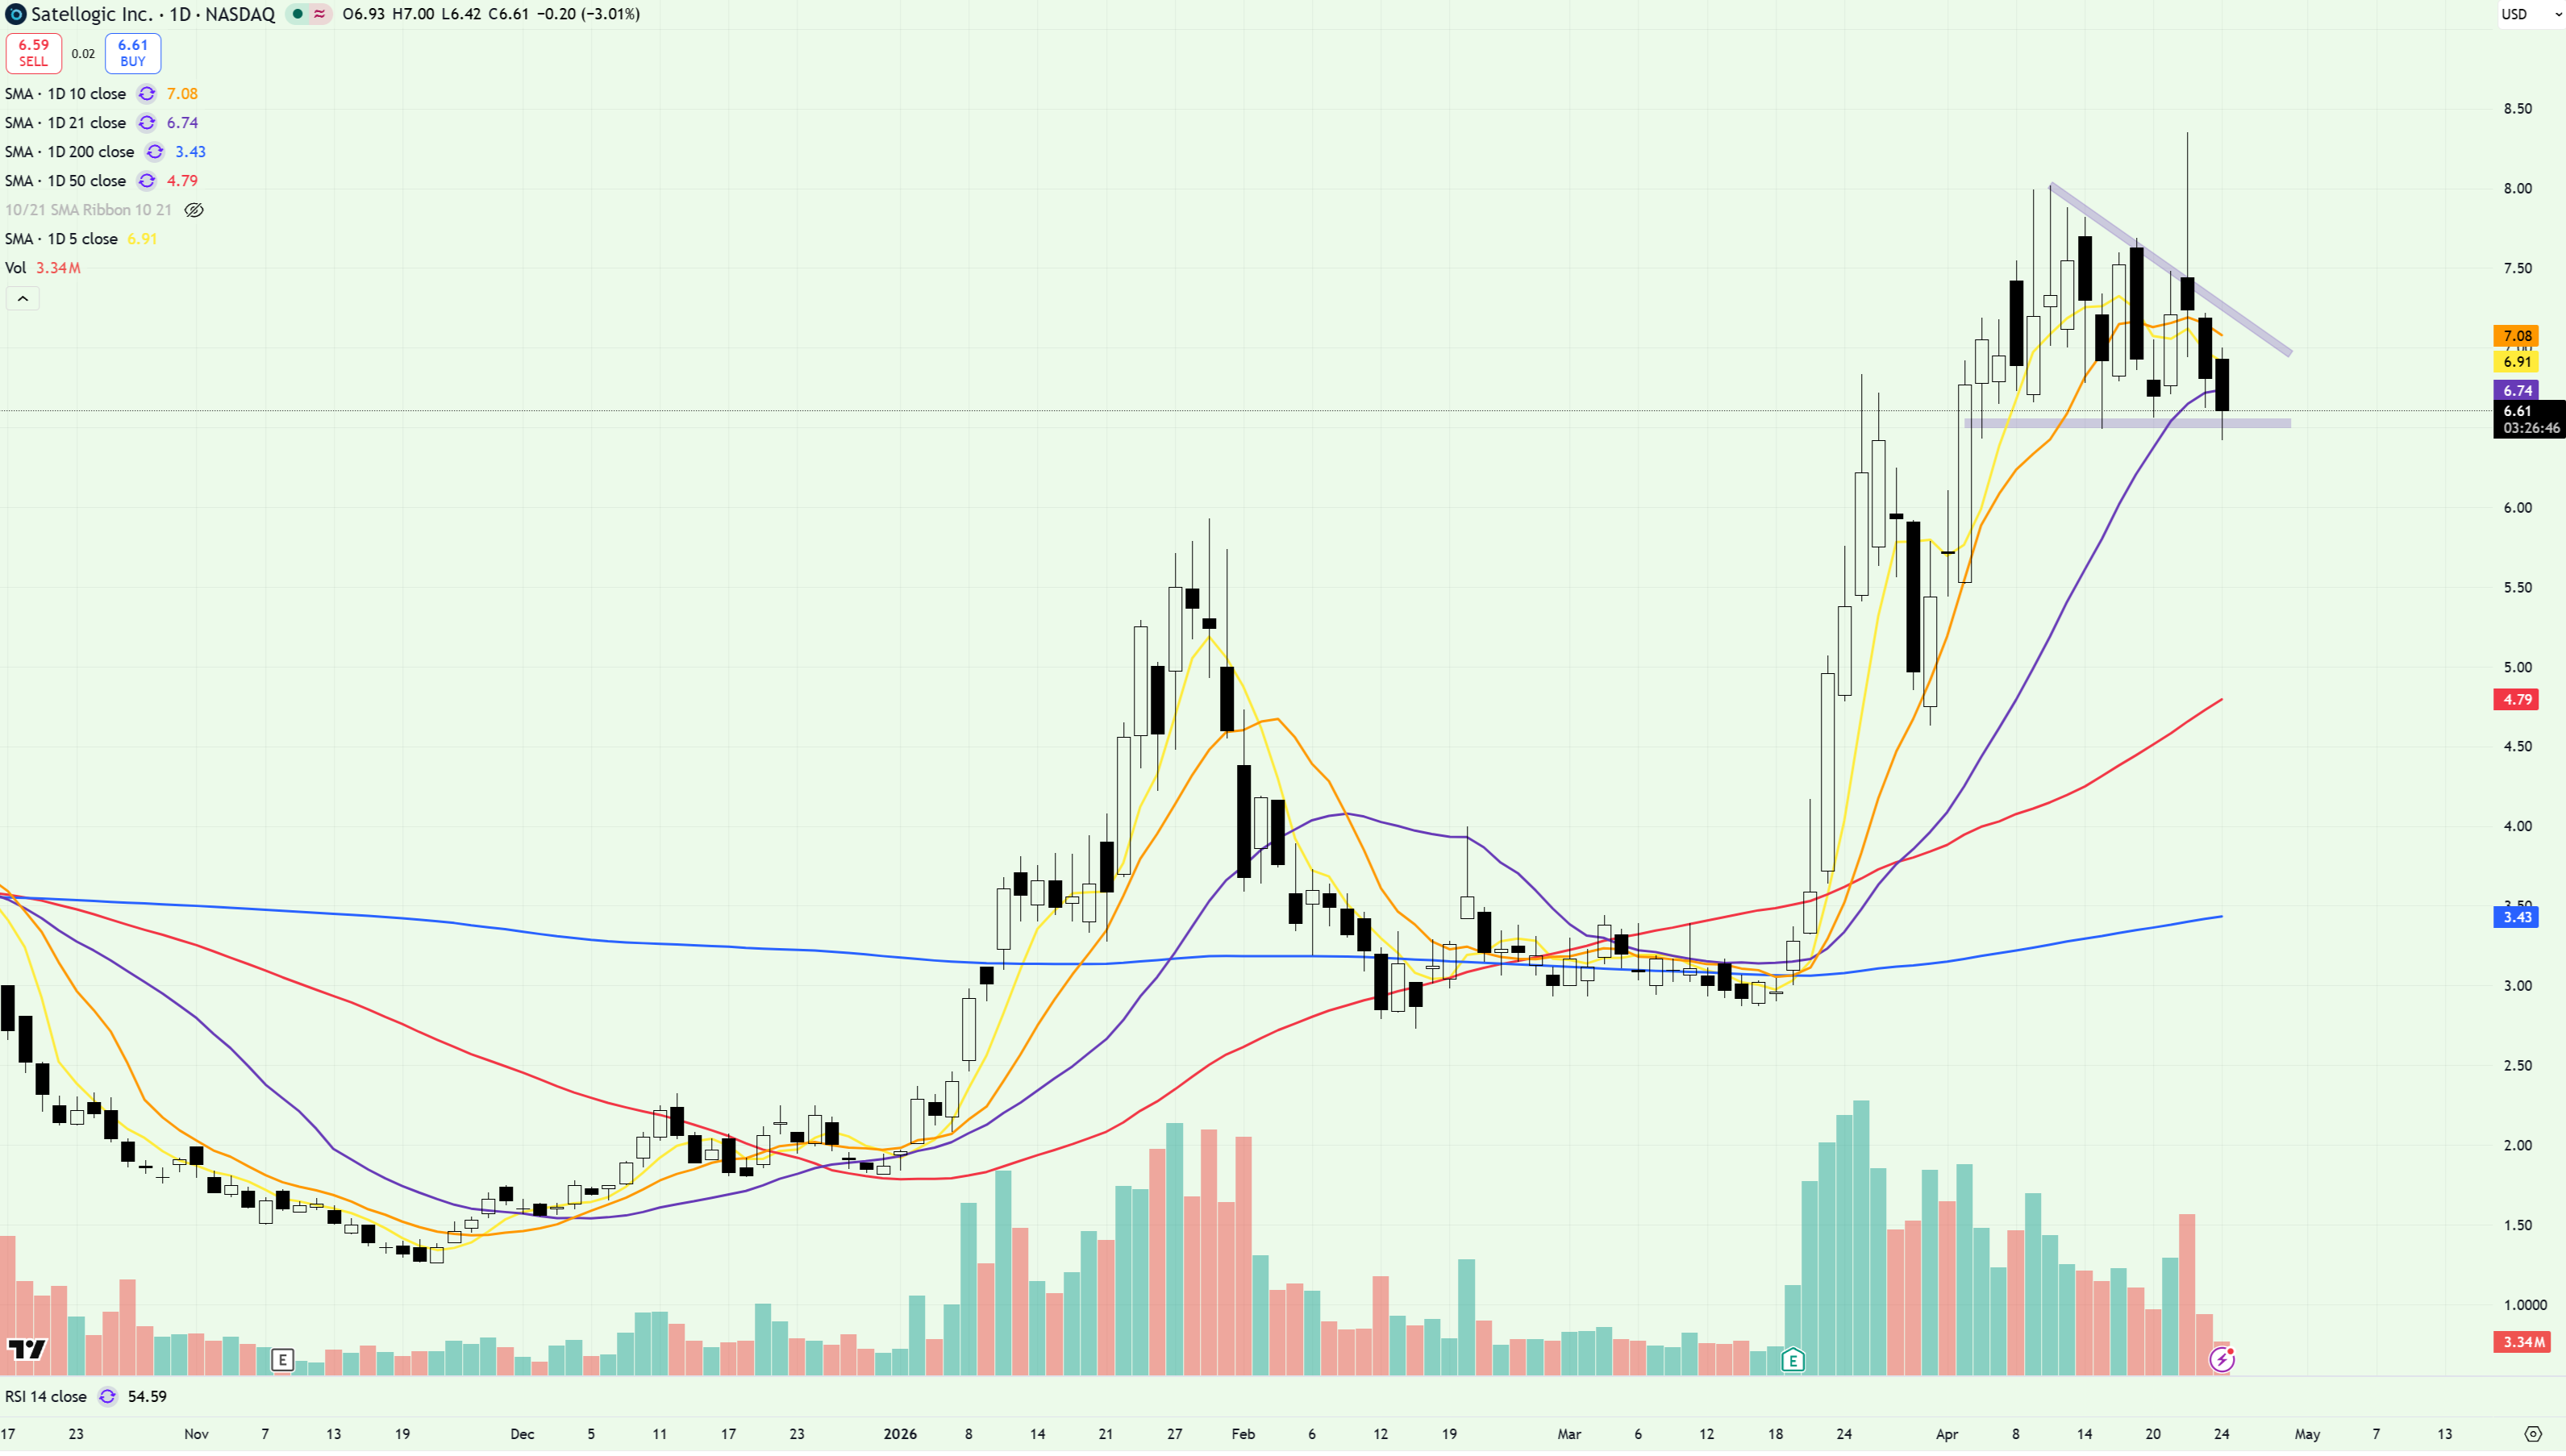
Notable tickers in this space include:
GLW
SATL
RIOT
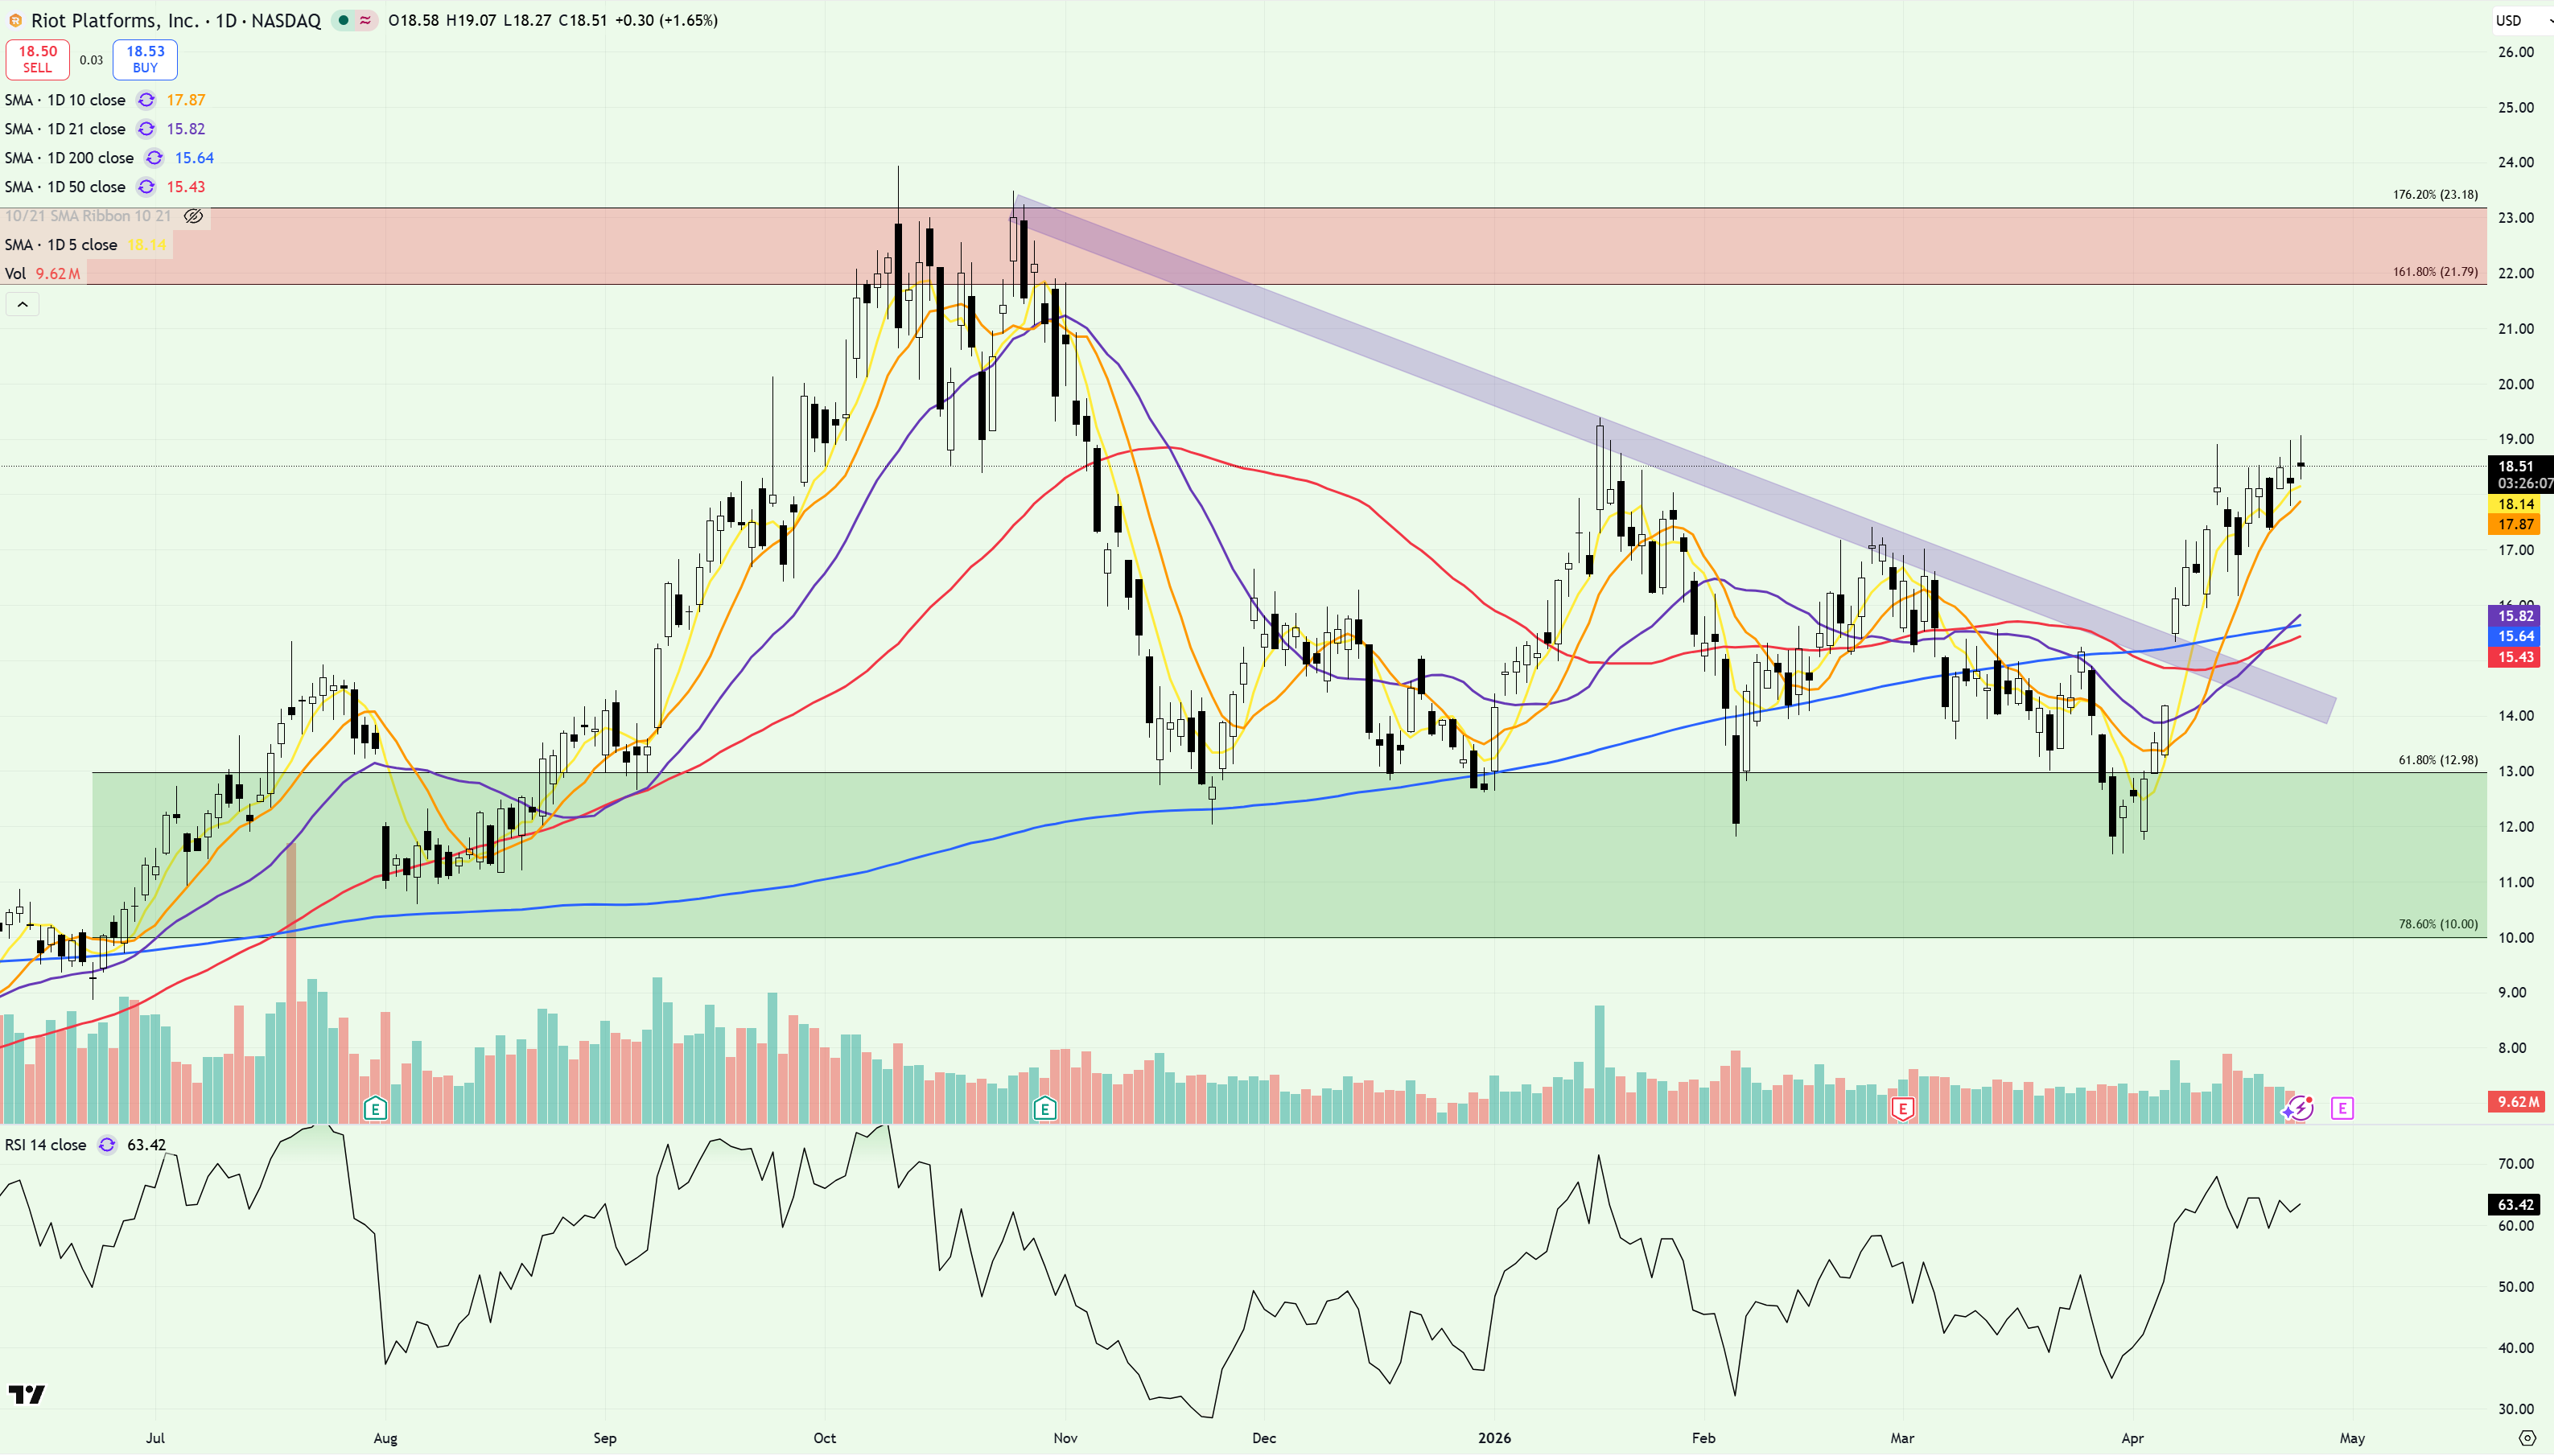
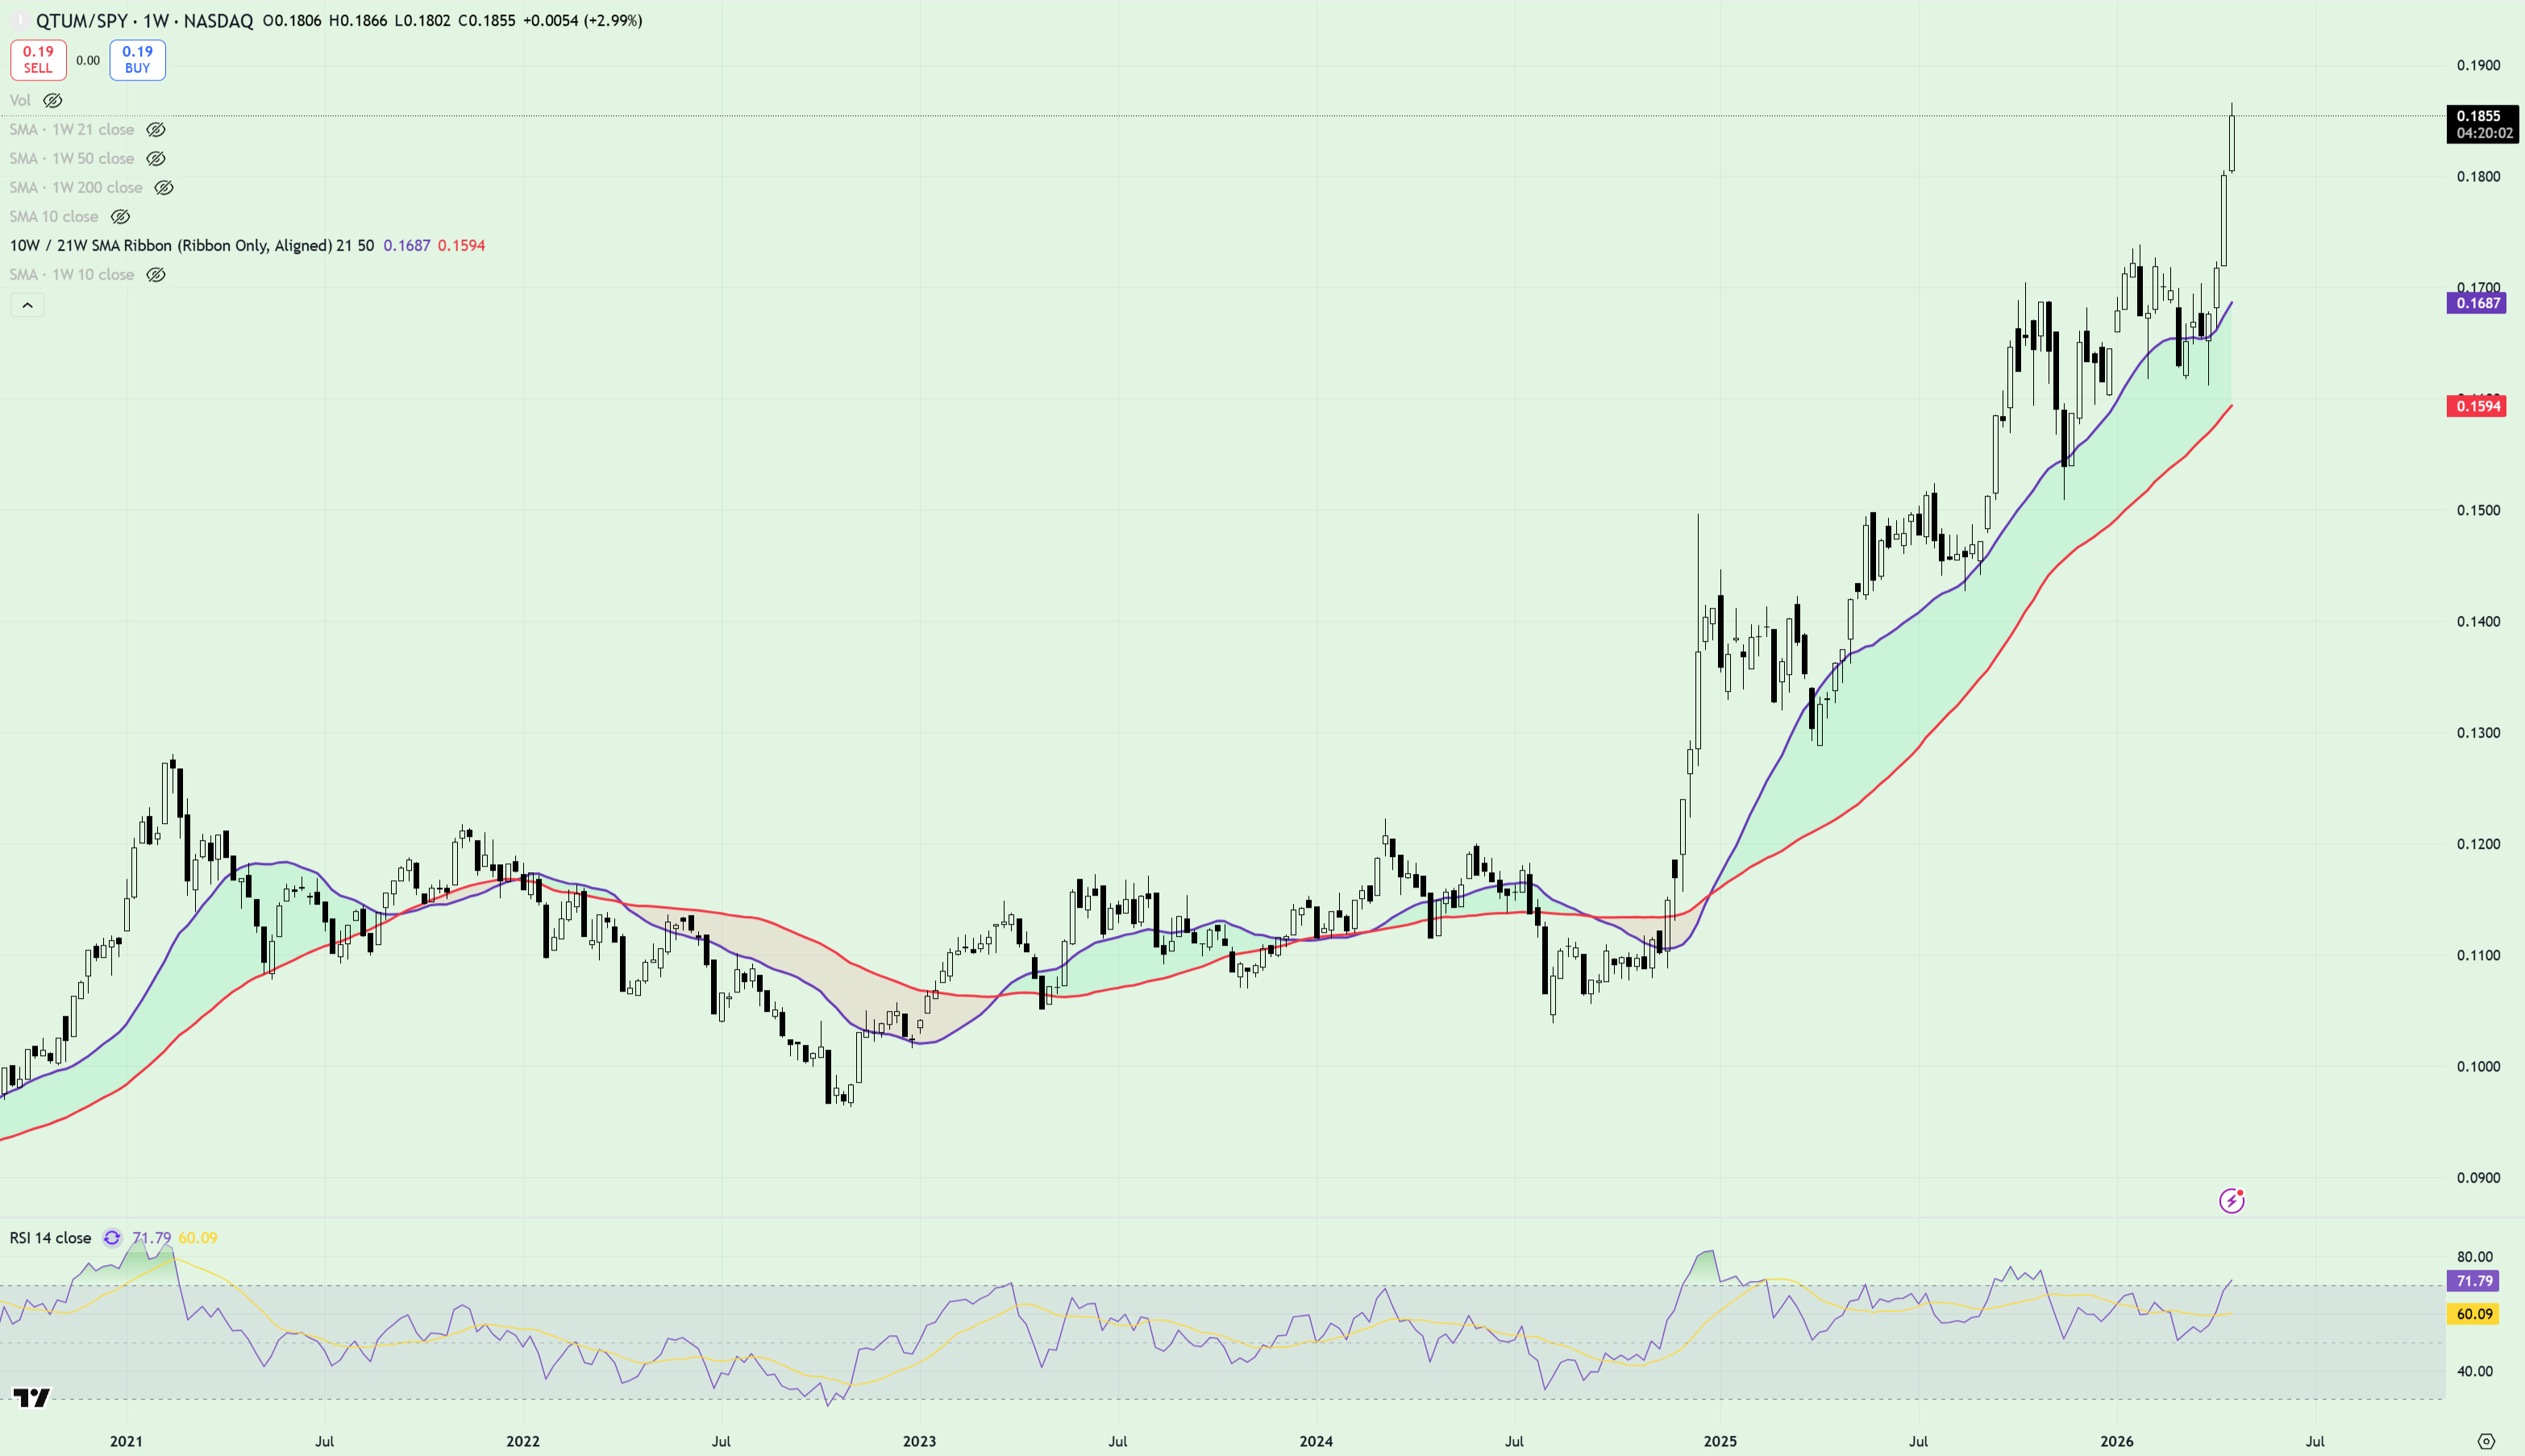
Quantum stocks look pretty similar too - note QTUM/SPY and its healthy relationship with the 21/50wma moving average ribbon, but similarly overbought conditions on the RSI.
Don’t Sleep on Energy
So tech is leading and dips are buyable - no shit, Al!
Ok hear me out. How about a little…energy.
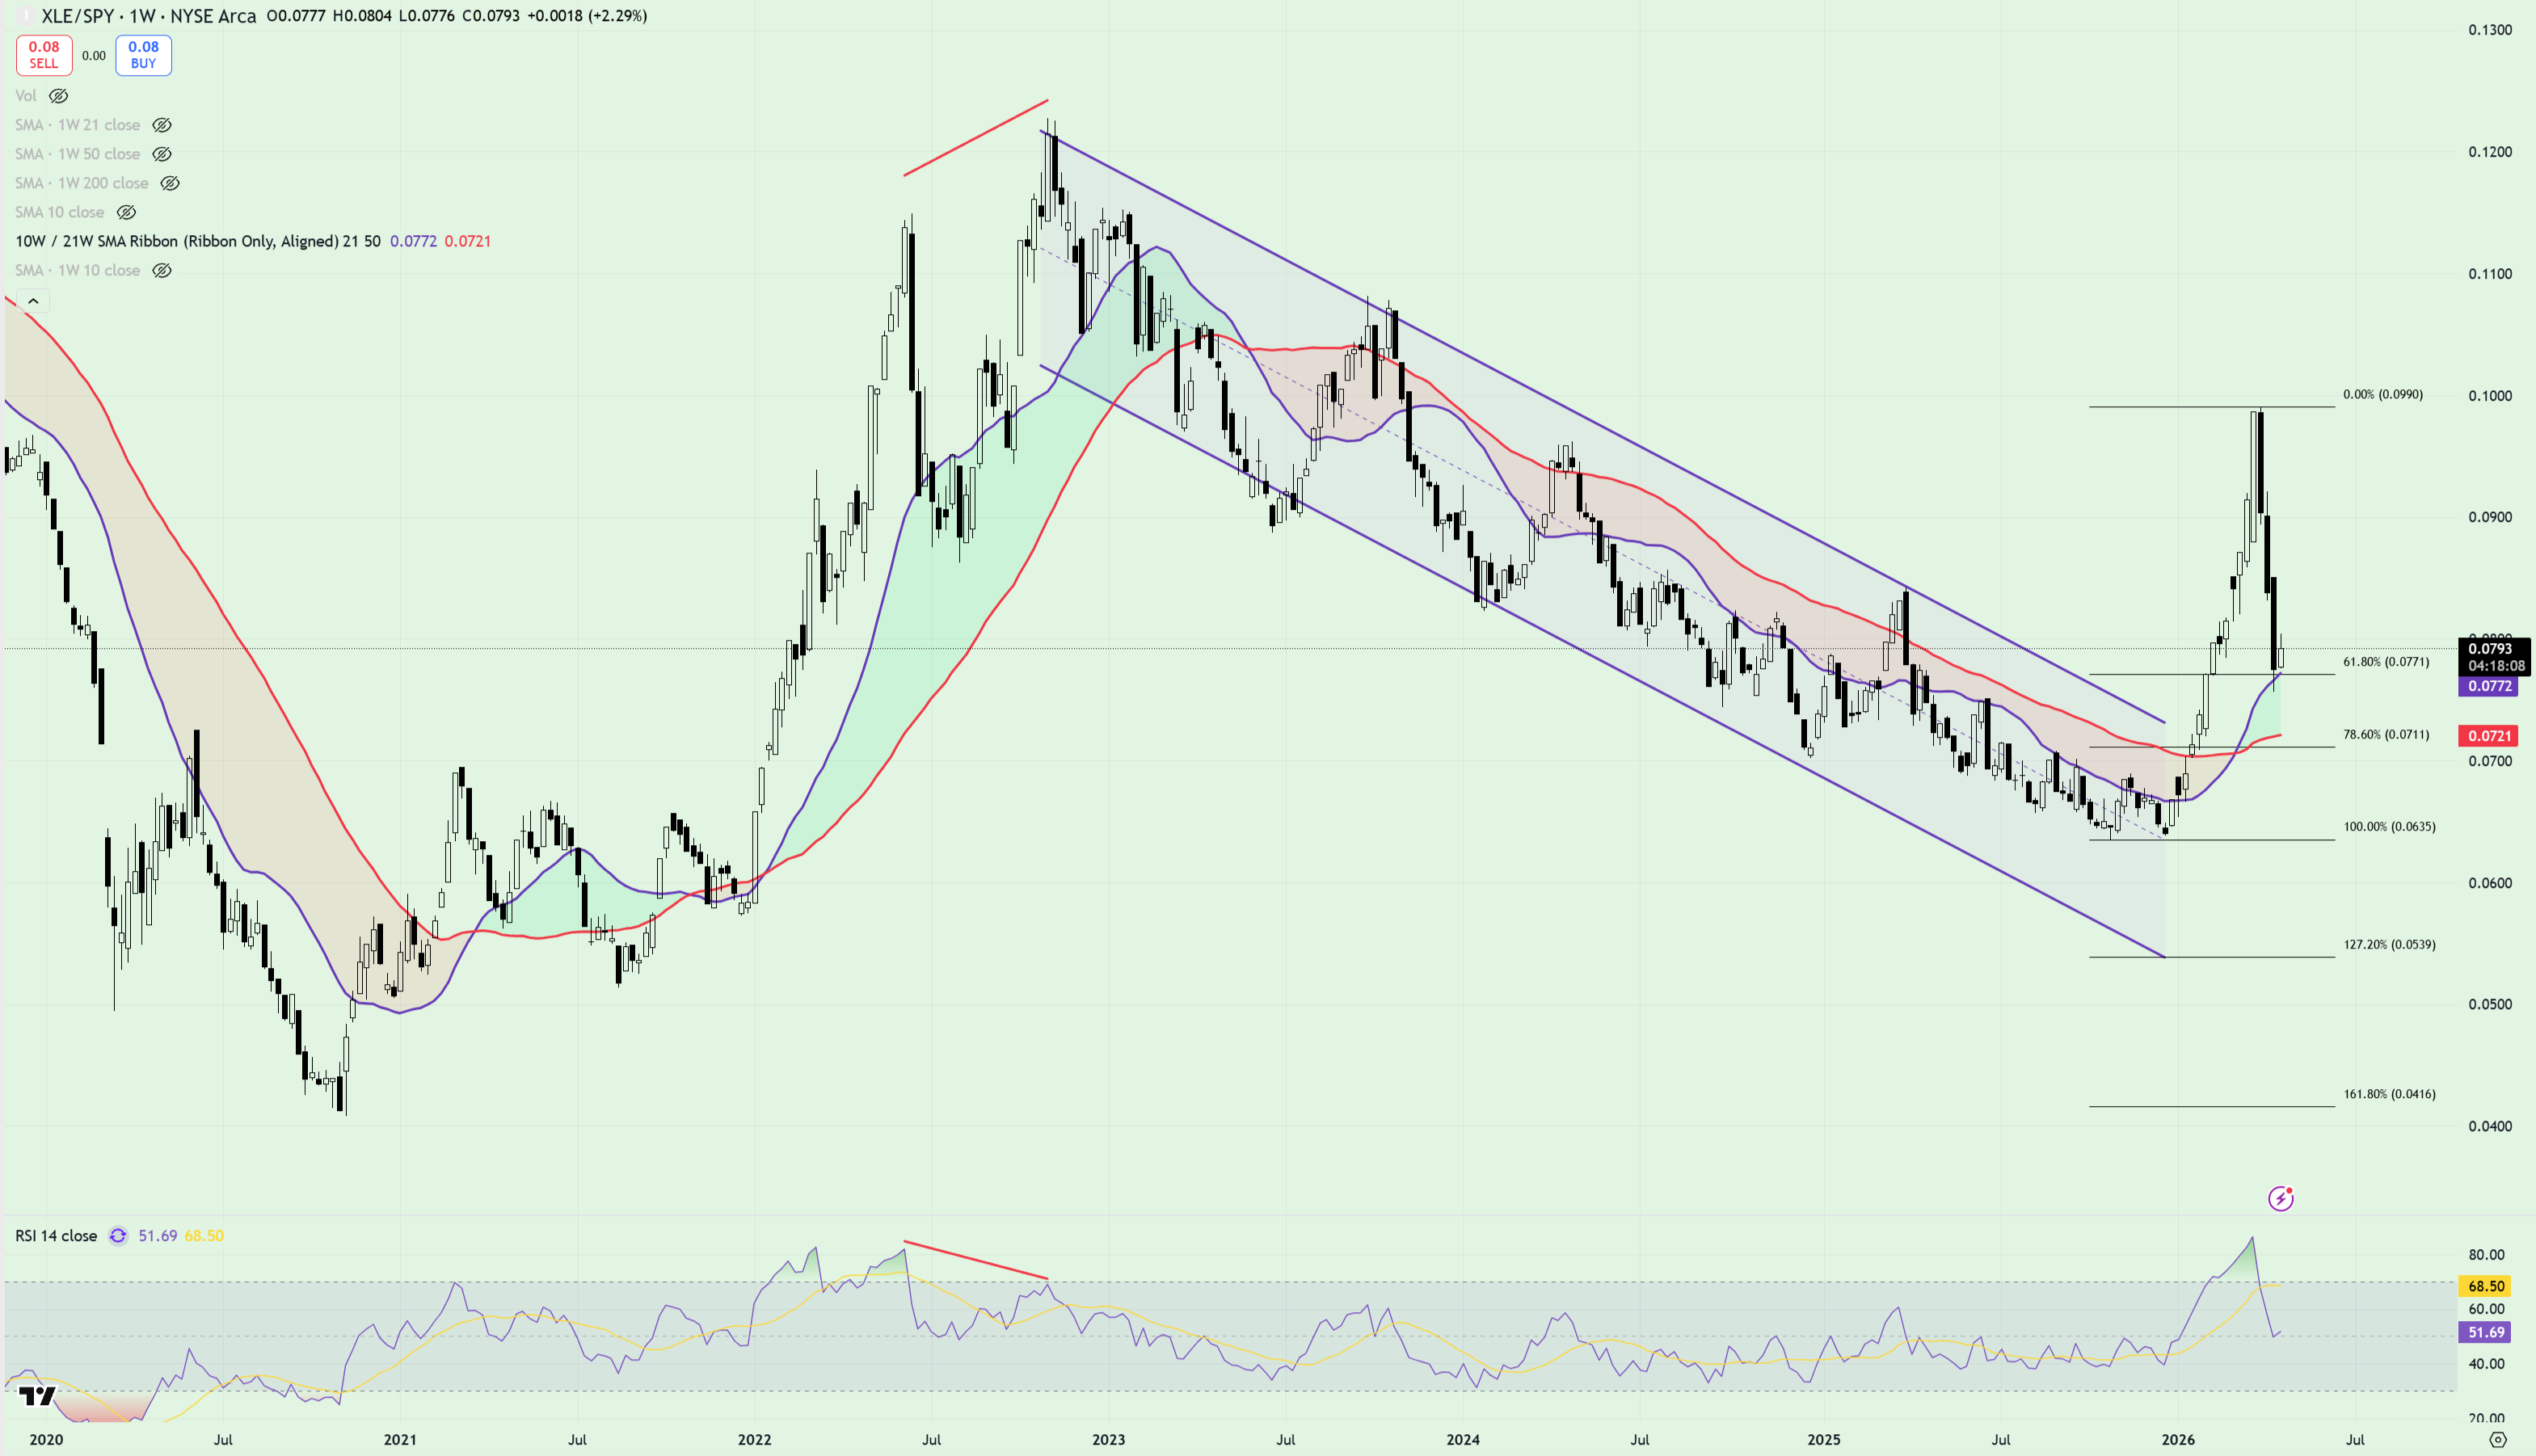
If we’re being objective - the bear minimum as traders - then you’ve got to admit that XLE/SPY looks OK at this level.
Sure, it’s taken a swift beating over the last few weeks as geopolitical tensions have eased, but there’s definitely a bullish setup here so long as price holds above the 21/50wma ribbon and the 61.8 fib retracement level in my view.
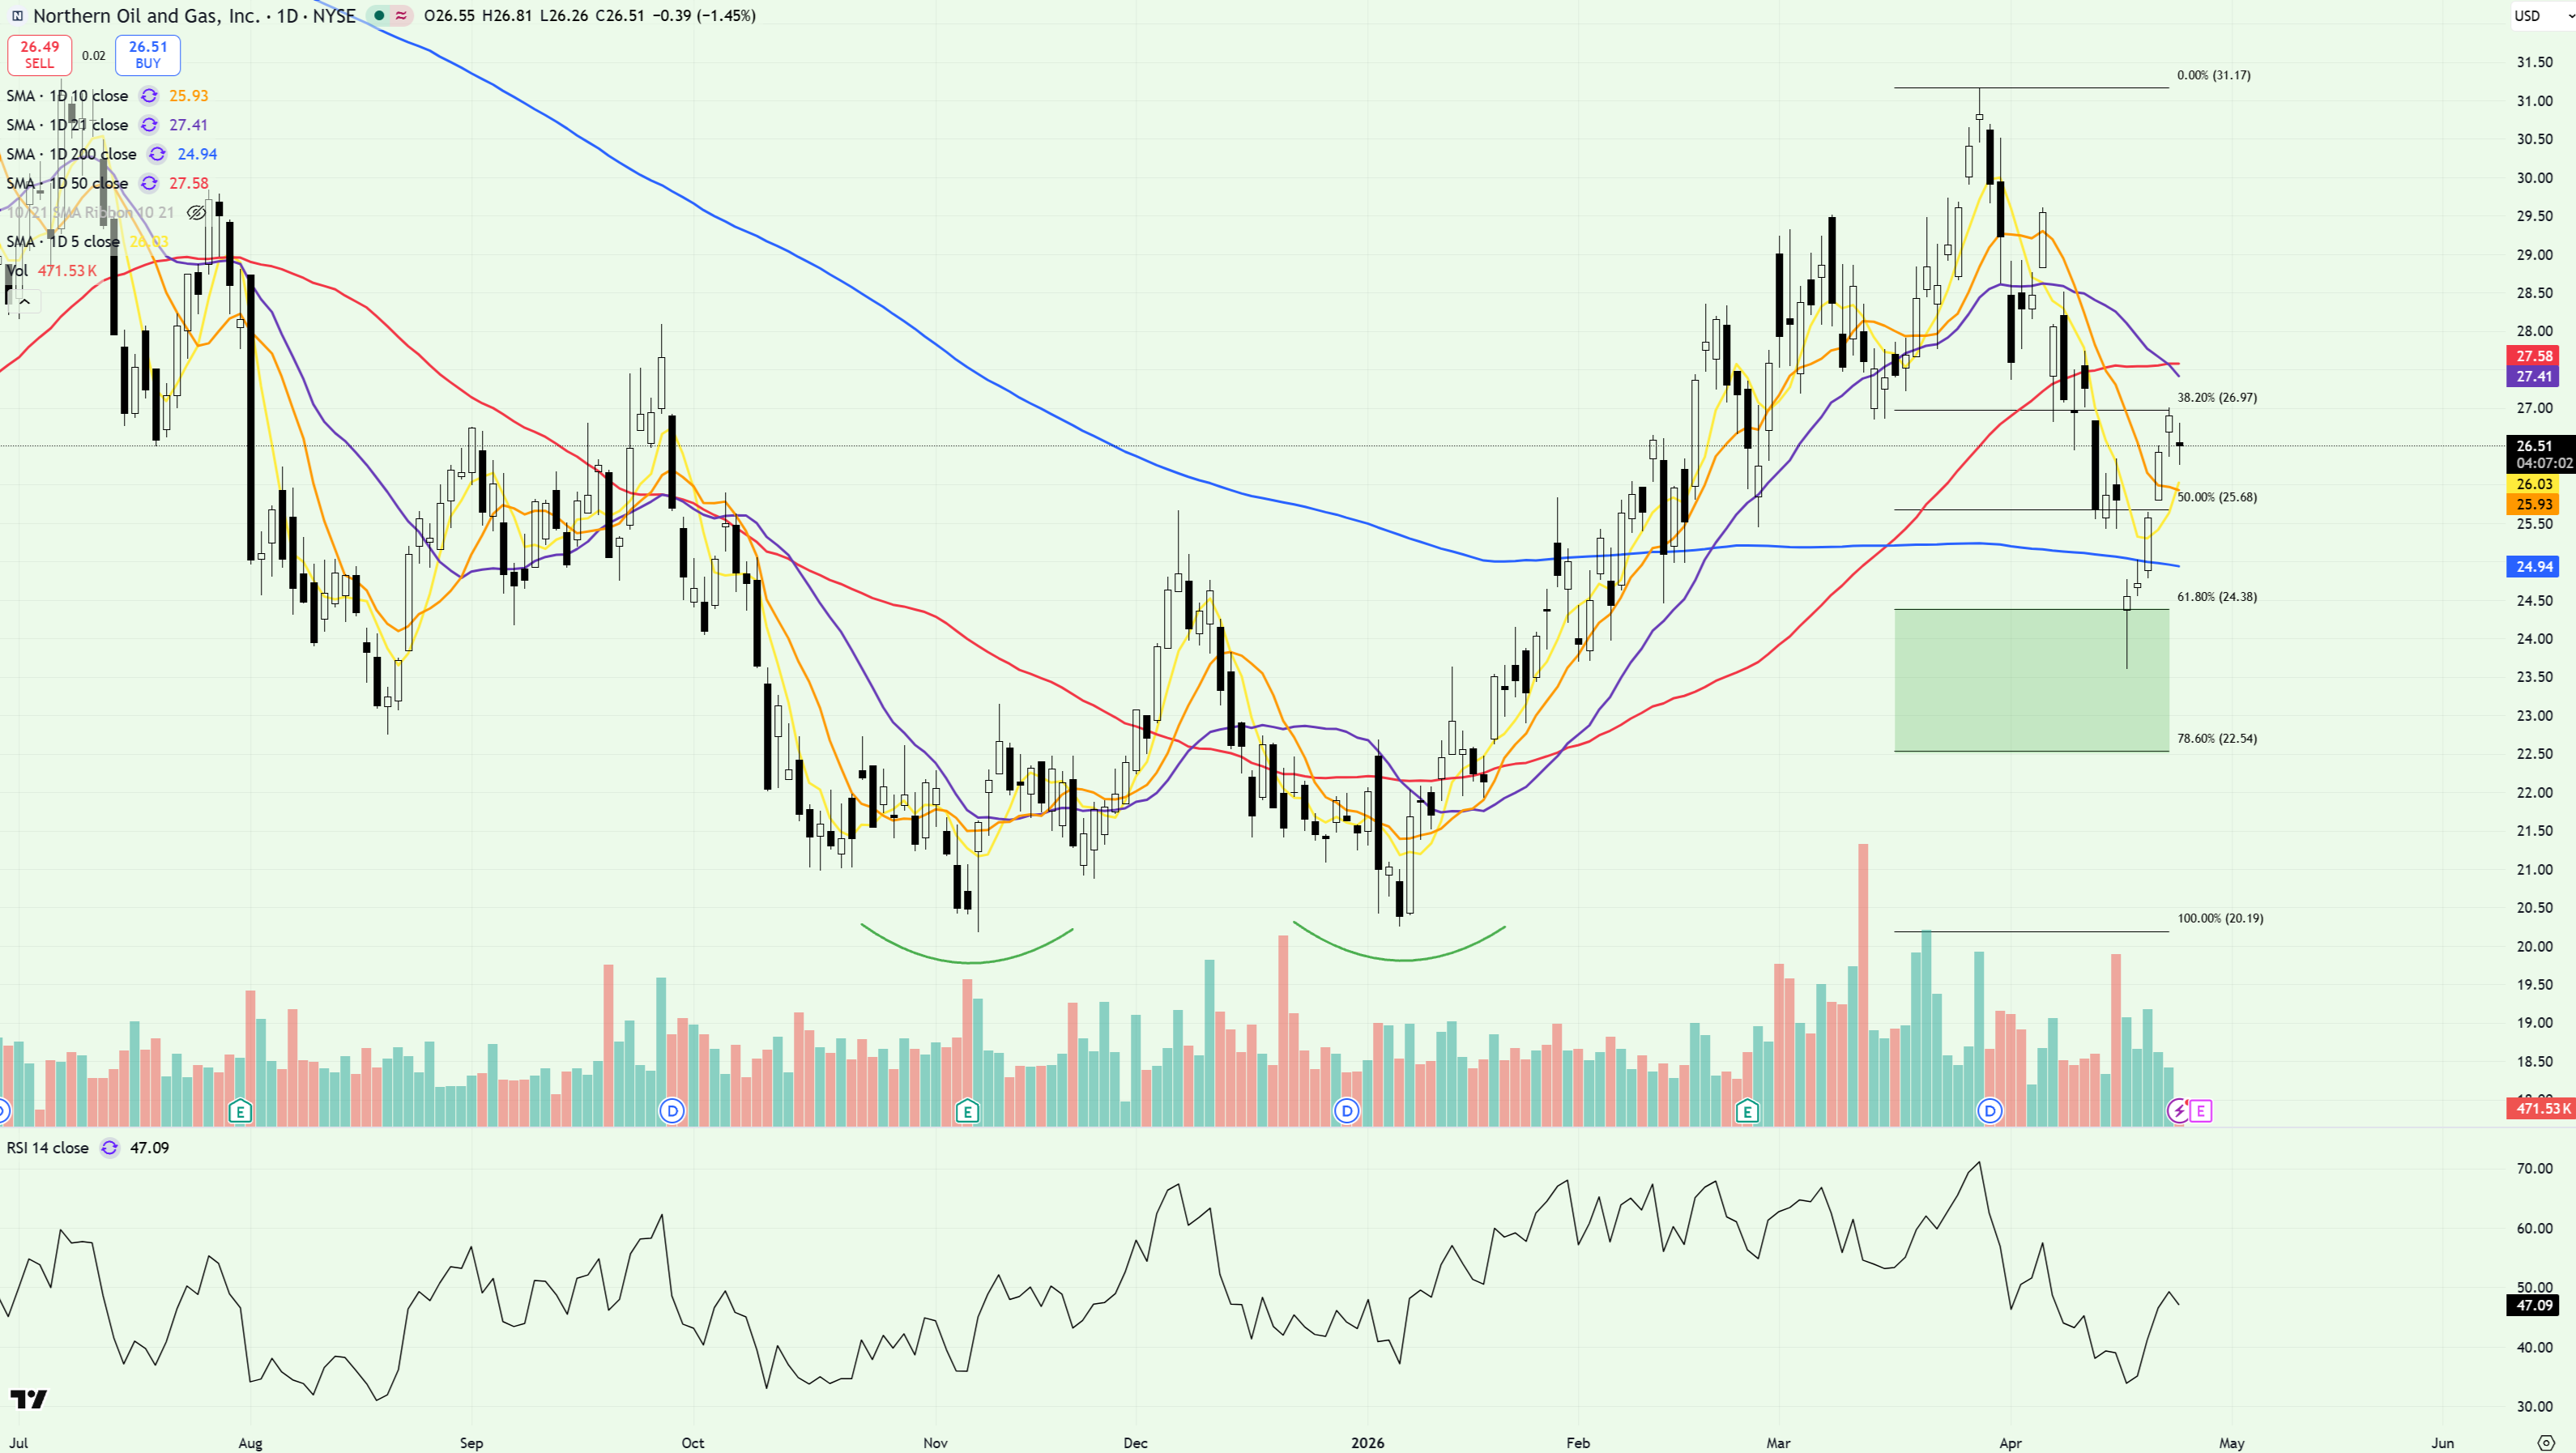
Notable setups in this space:
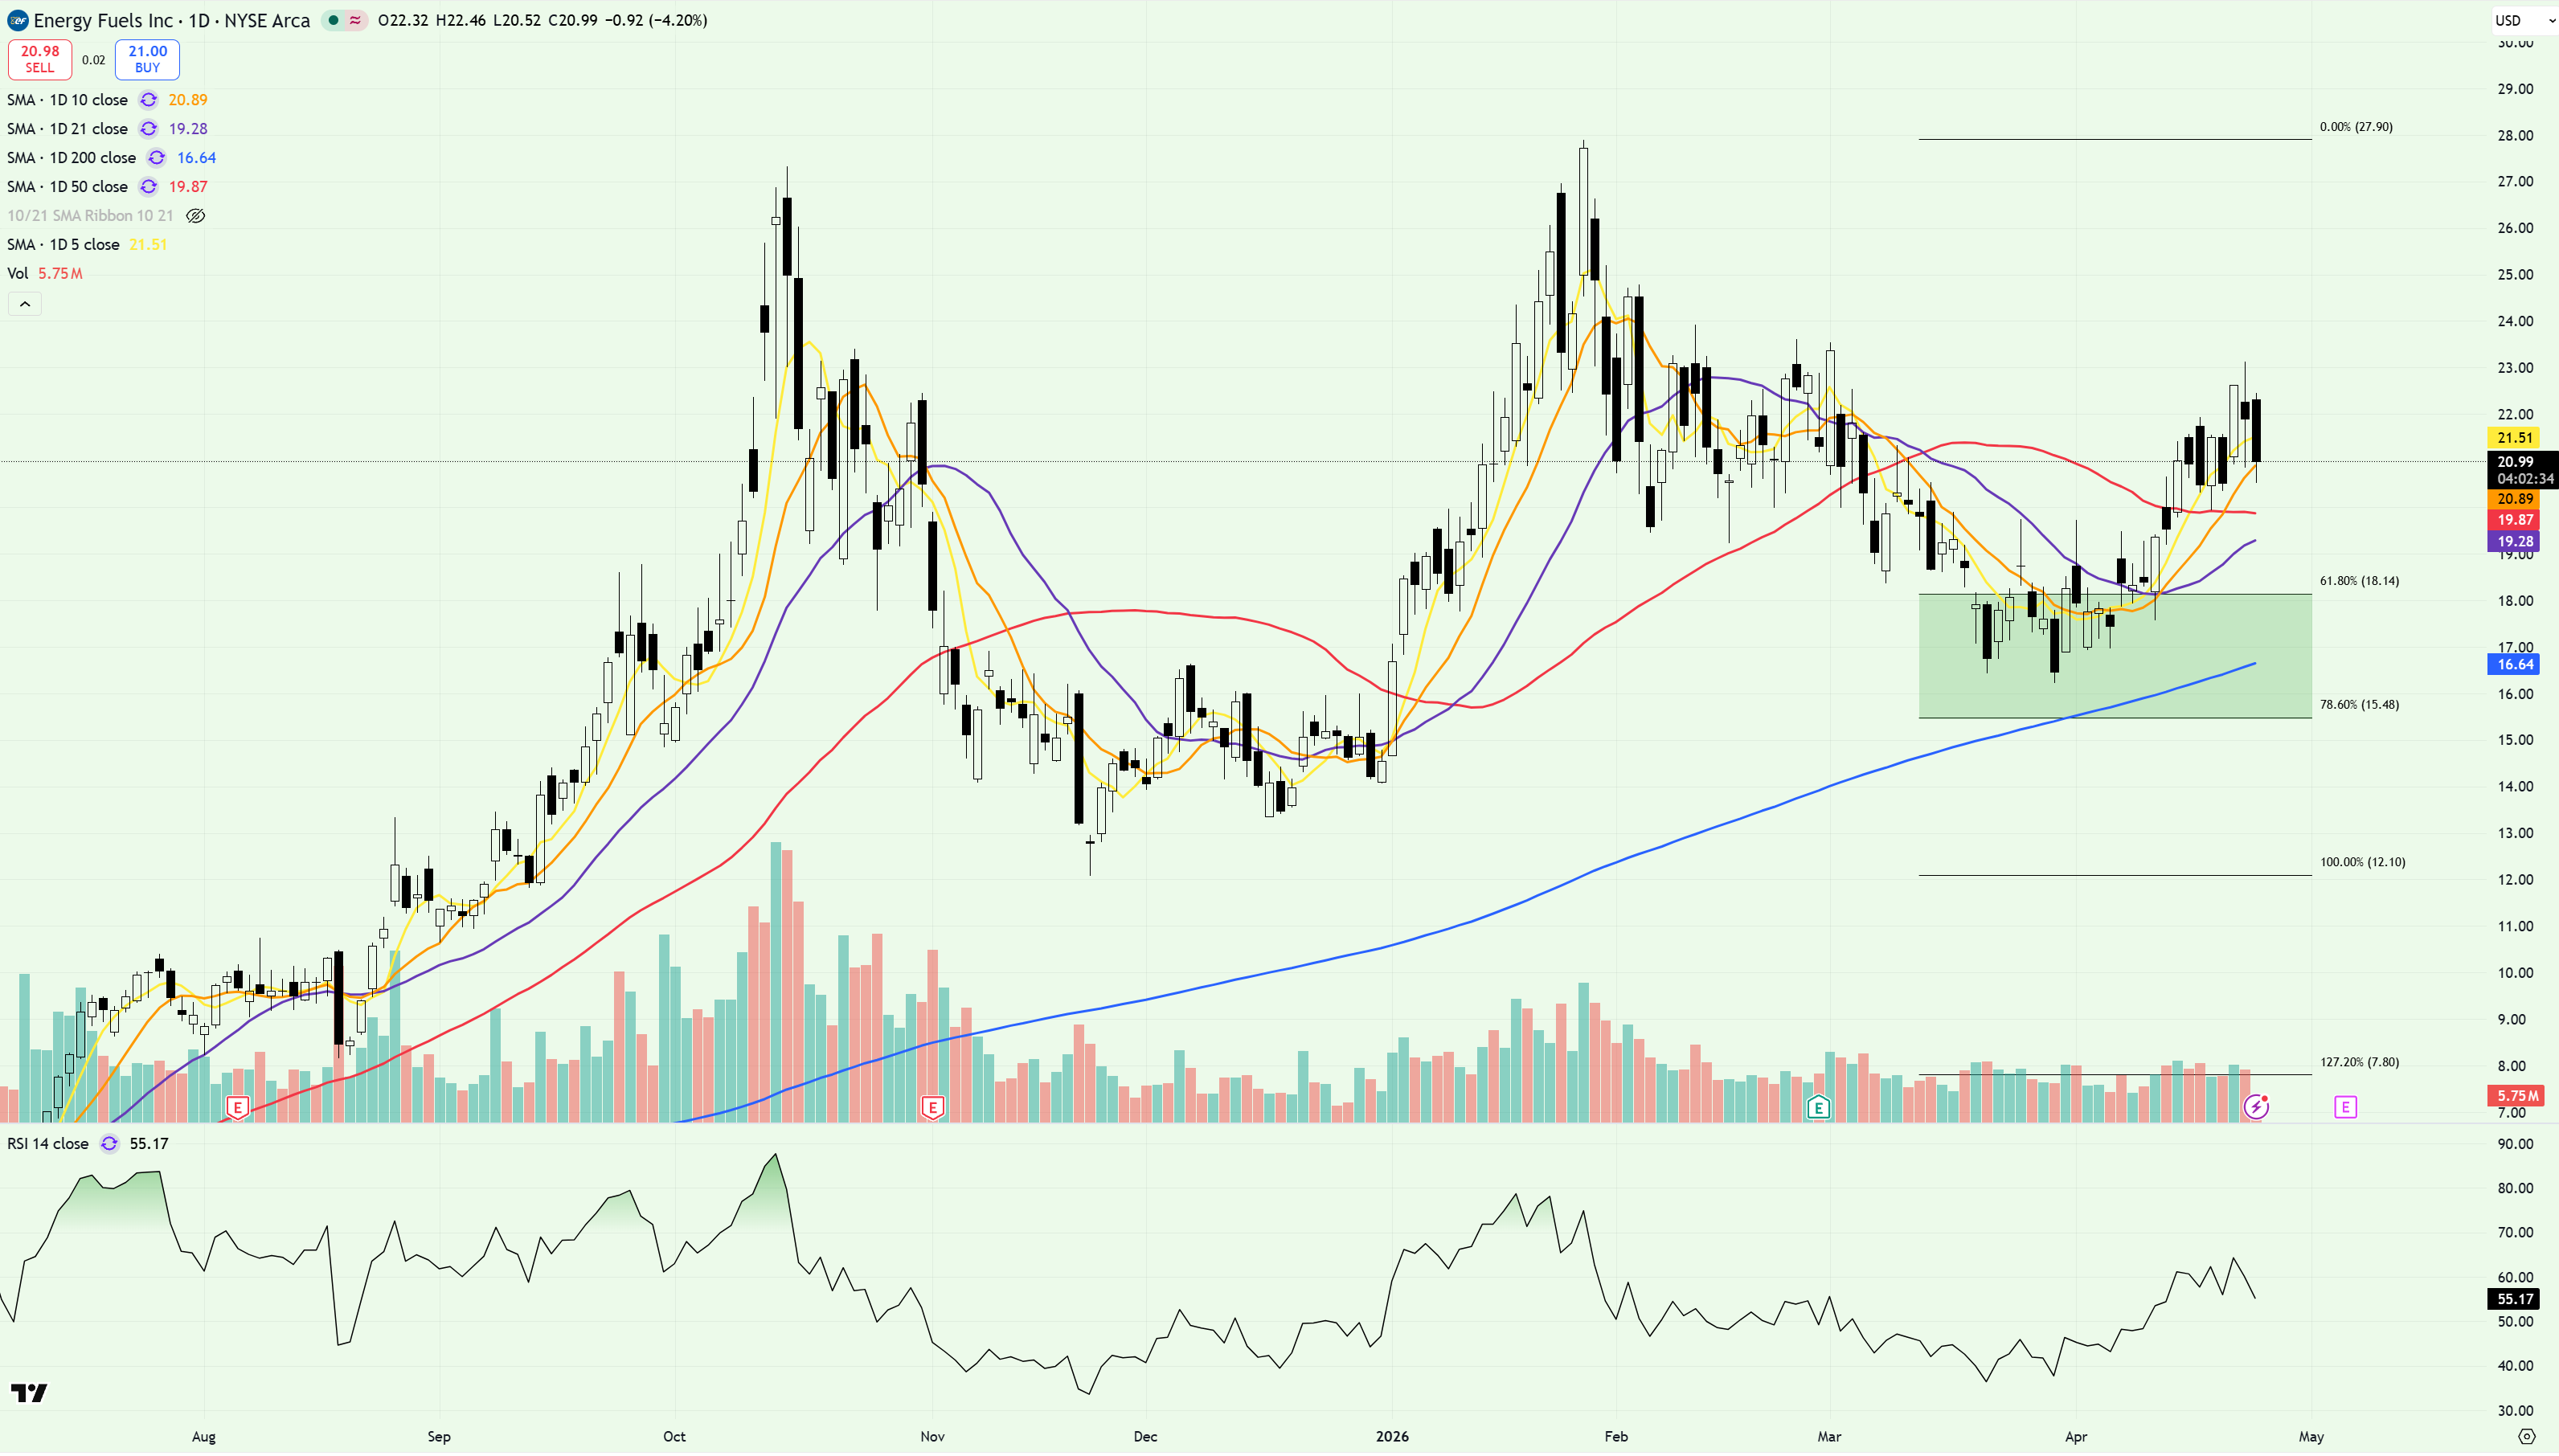
NOG
OKLO
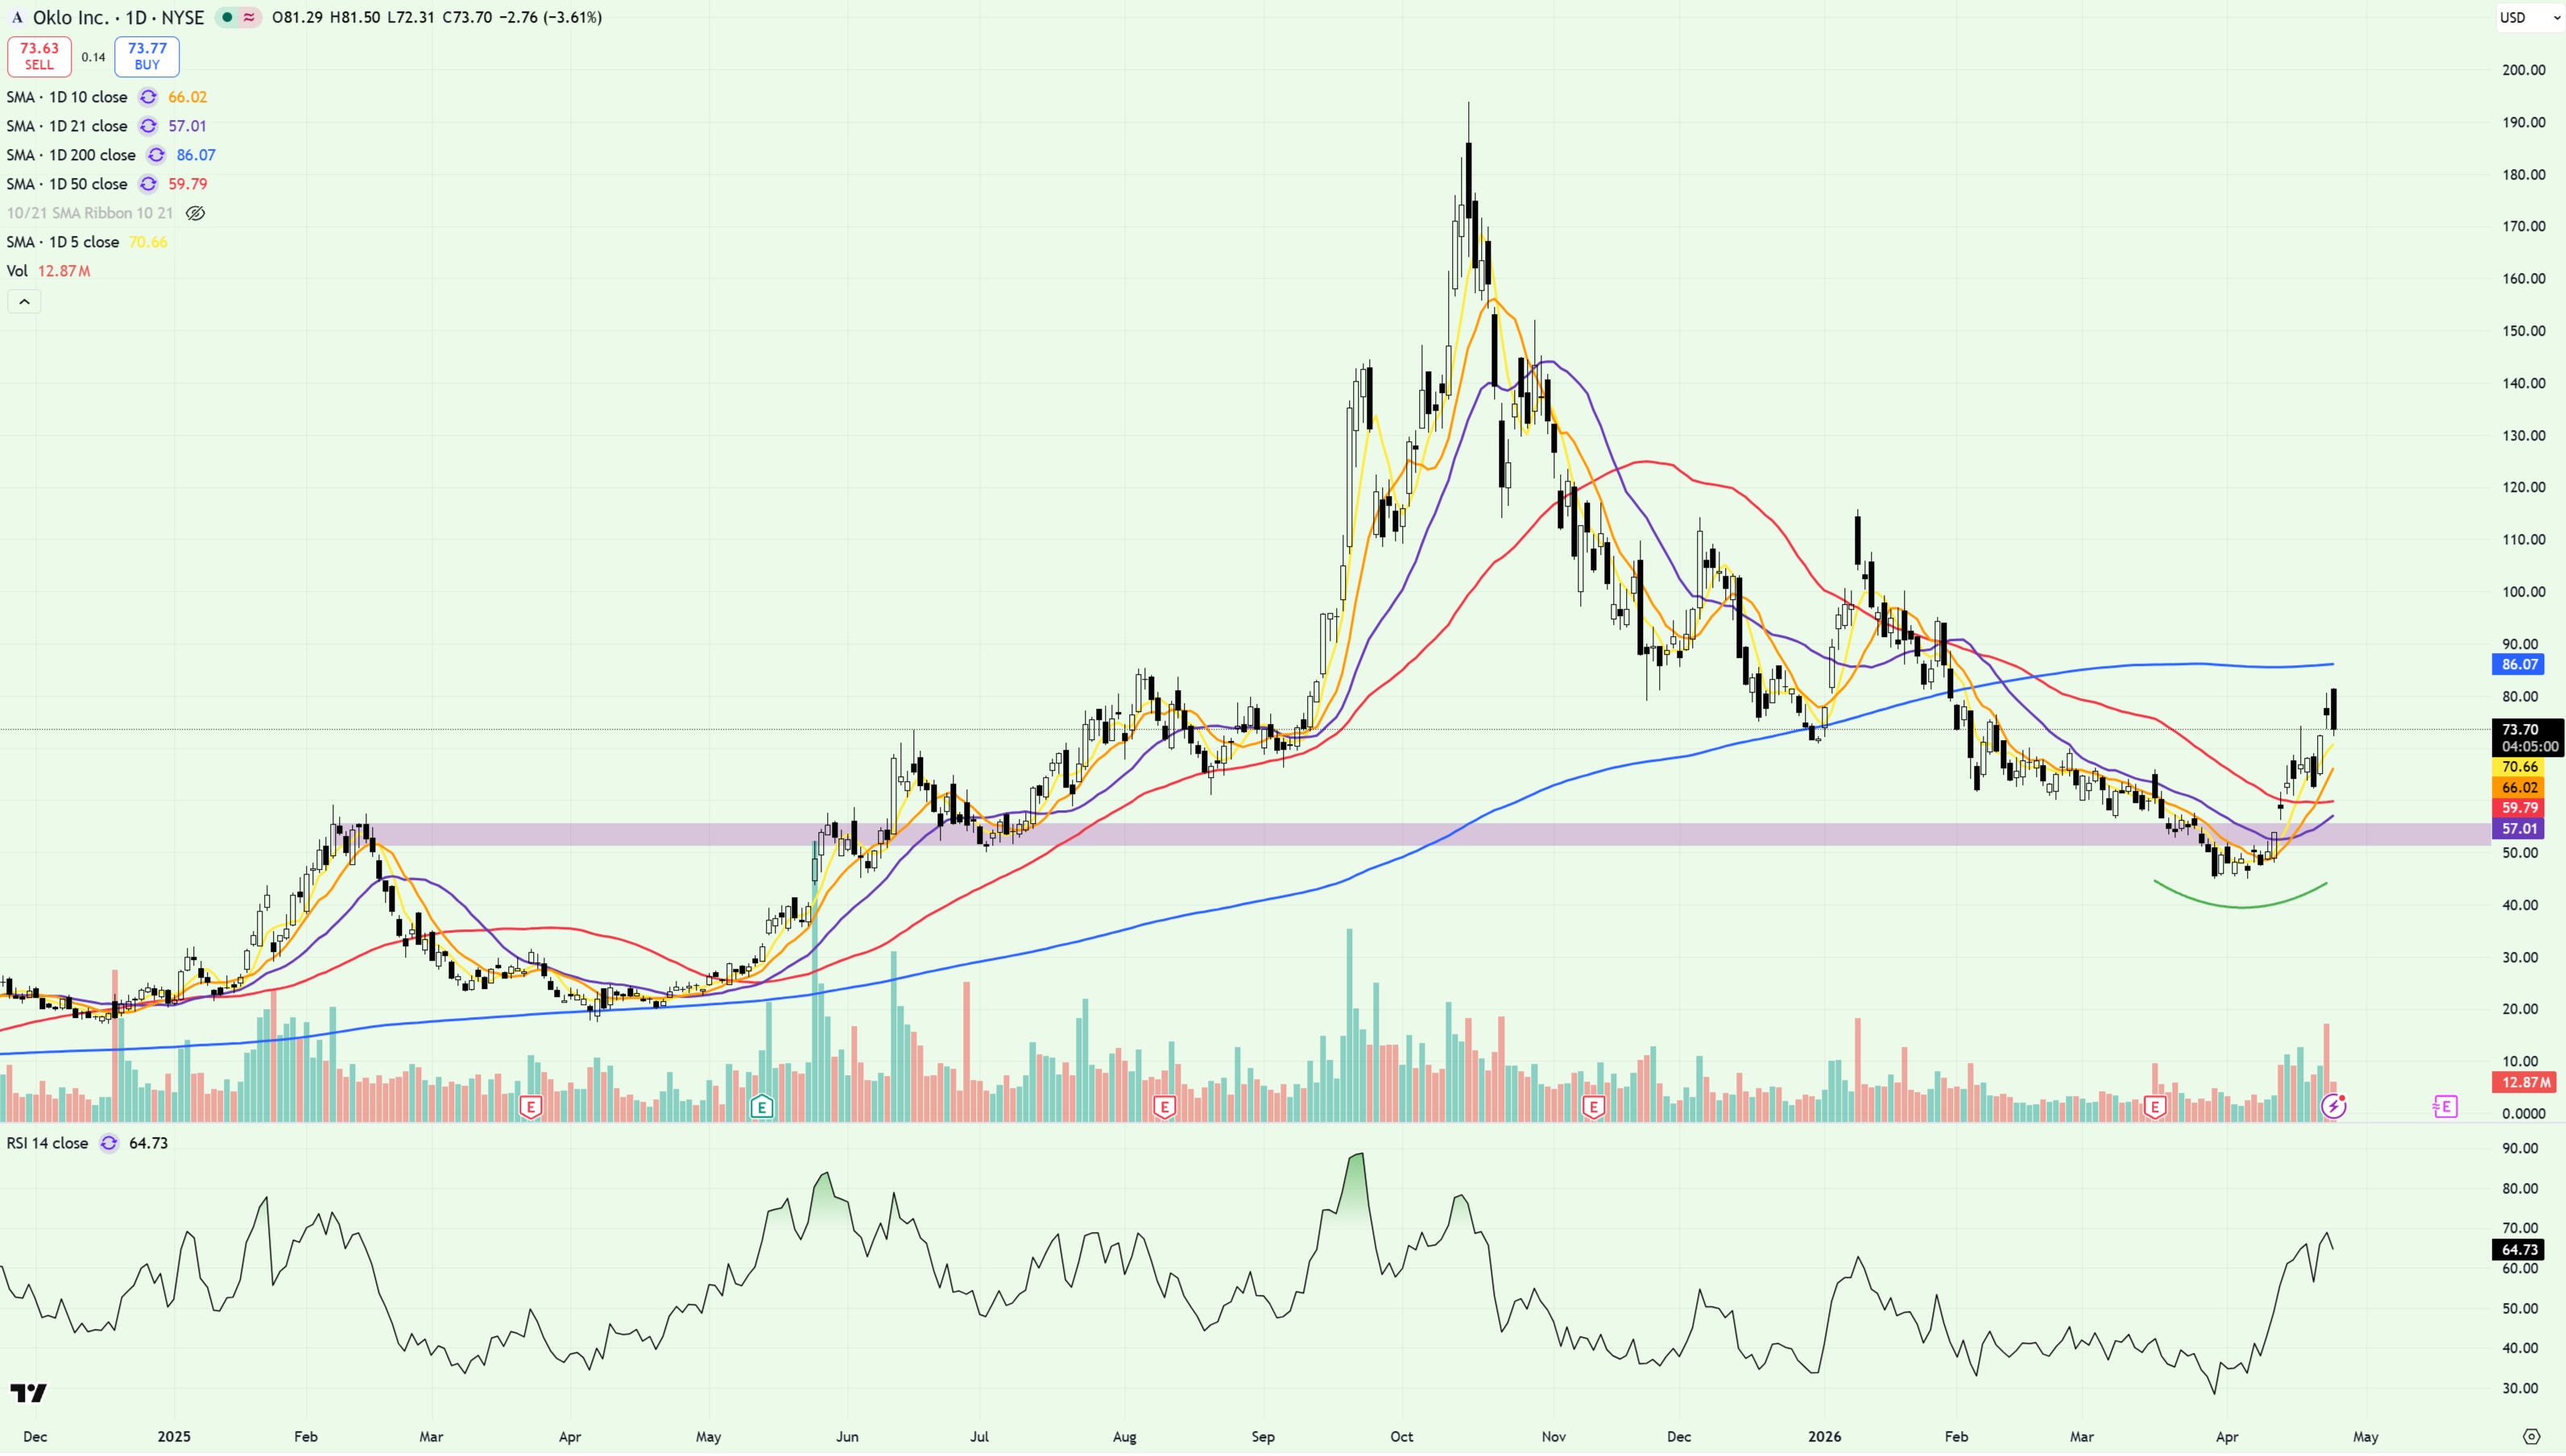
UUUU
What About Crypto?
Despite broader indices hitting new highs, the bounce that’s played out in crypto has been pretty muted, with Bitcoin, Ethereum and Solana way off prior highs - despite threatening to breakout from their respective ranges.
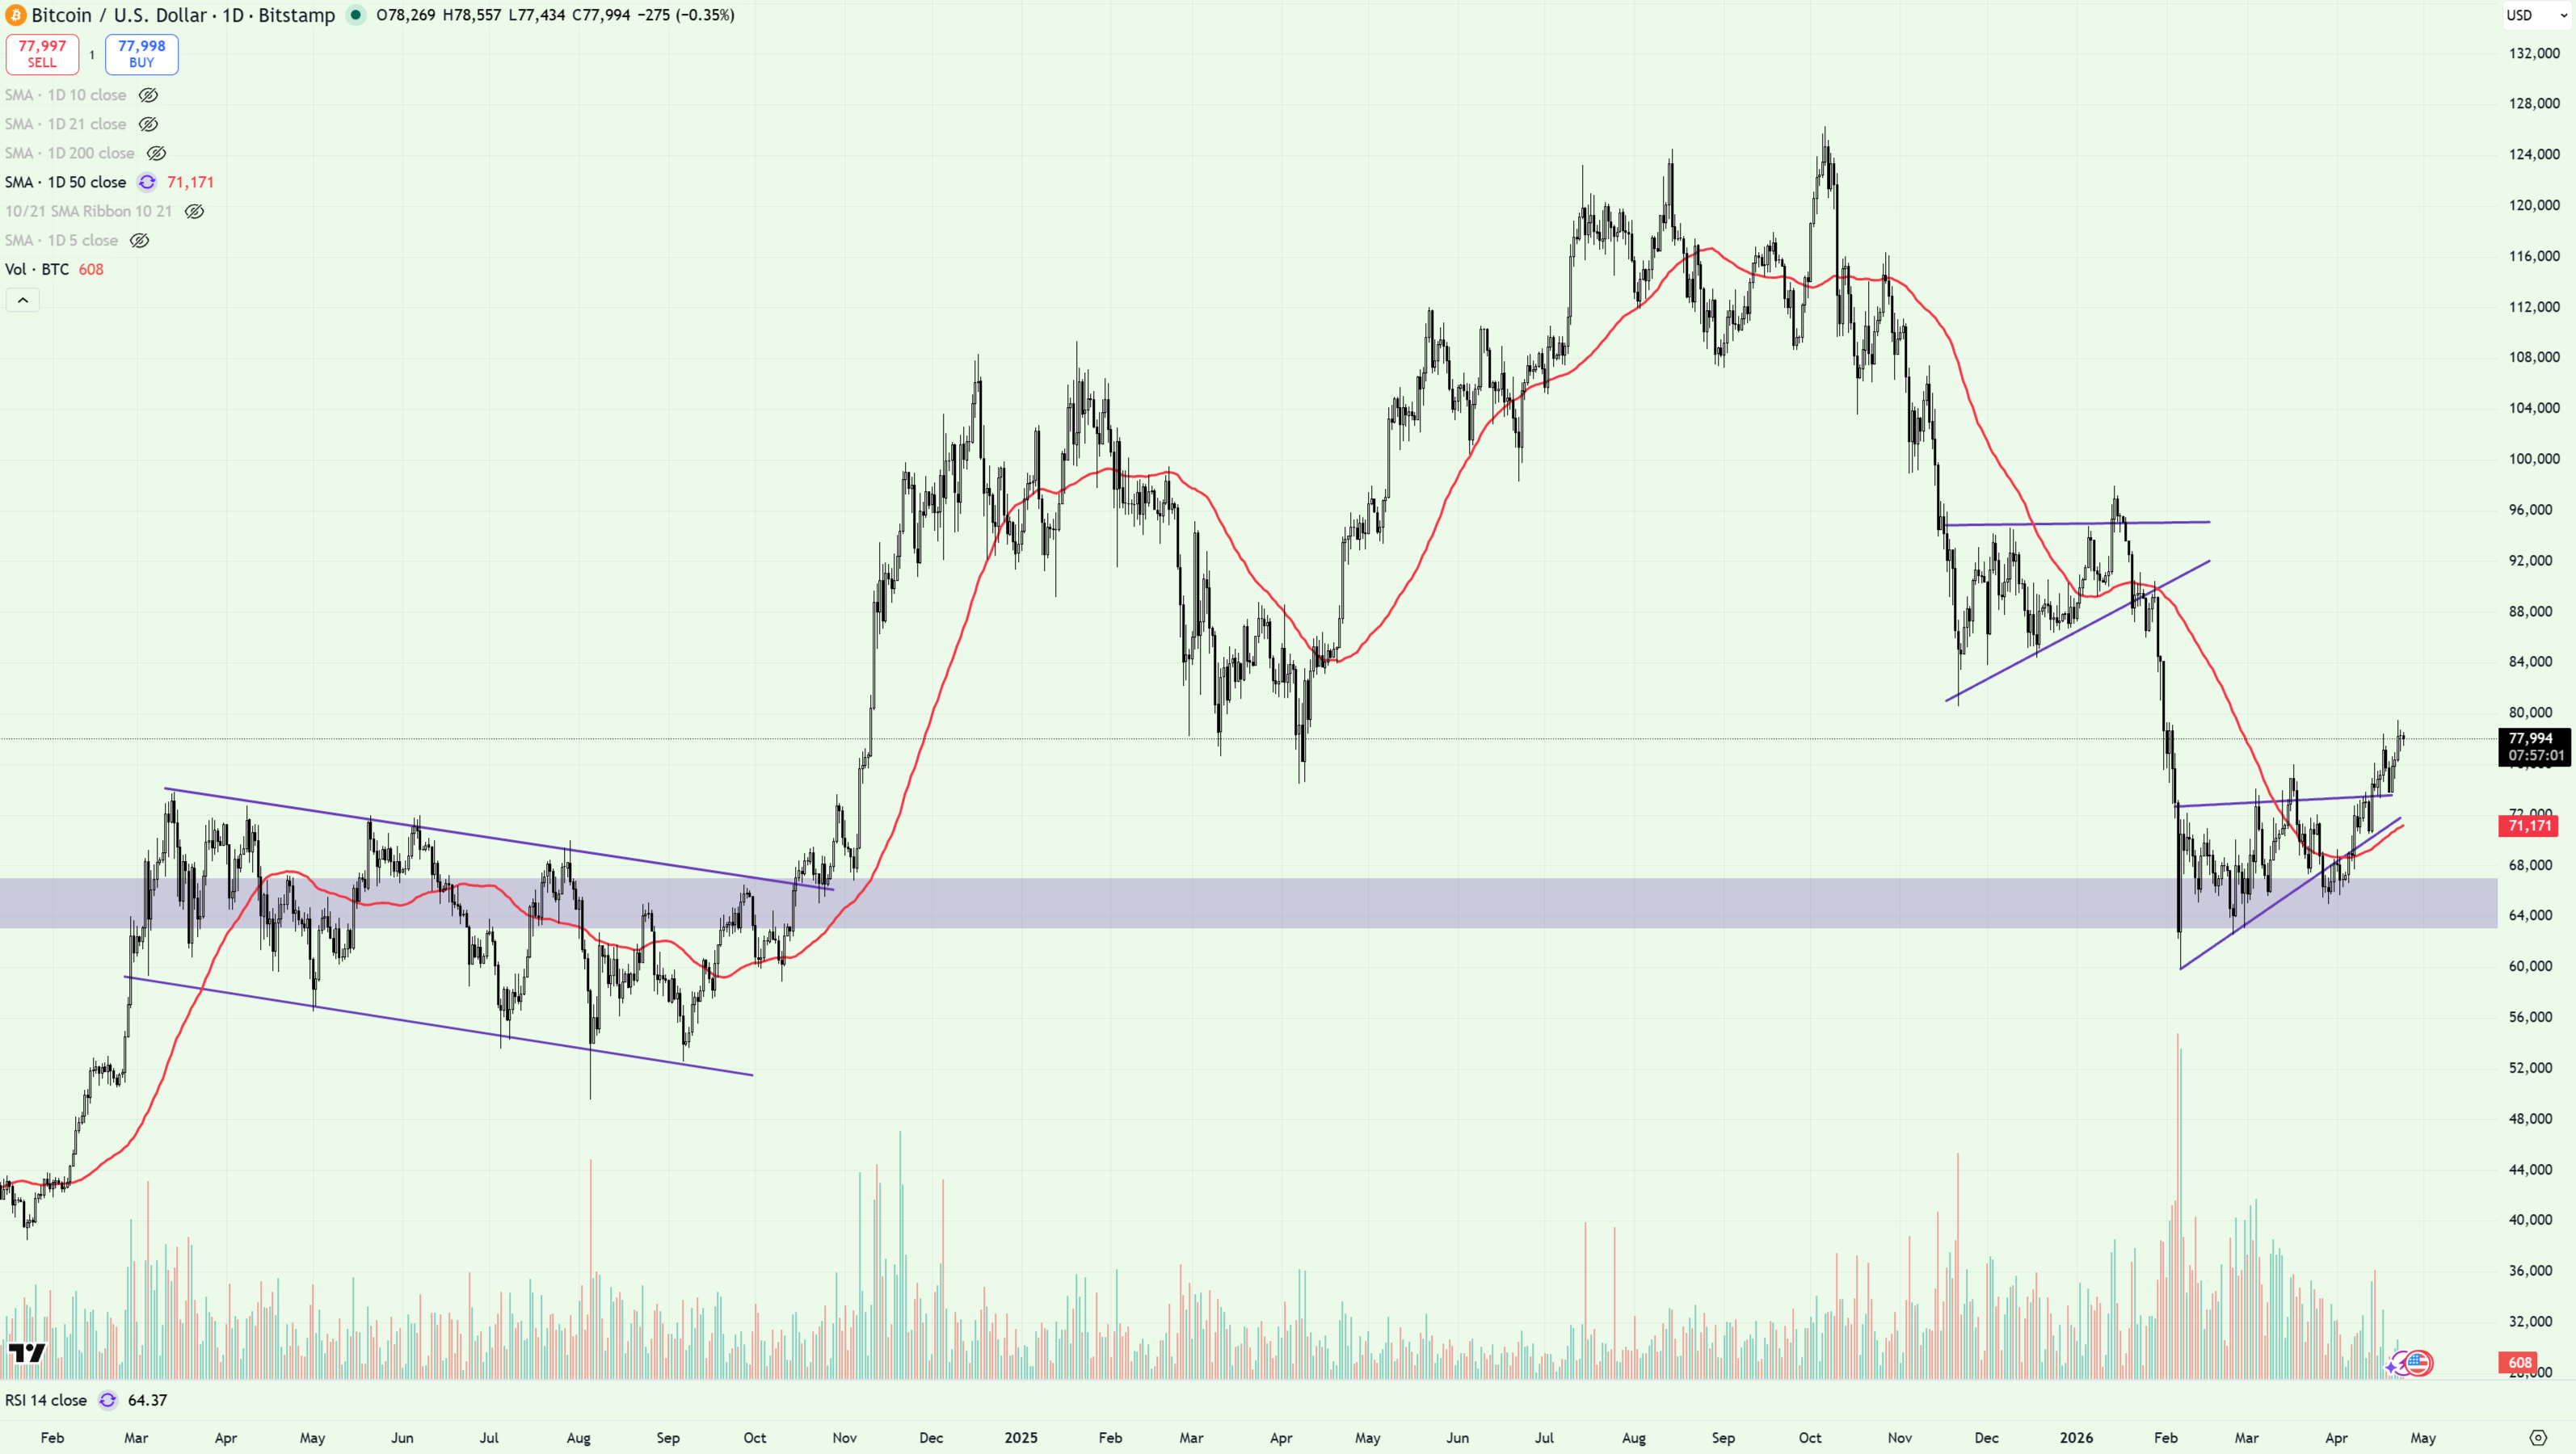
Bitcoin - the crypto market’s MVP - looks OK here. But if I’m being honest, I expected more given the moves we’ve seen across broader risk assets, namely semis and tech. Could we breakout over the coming weeks? Maybe - I certainly hope so.
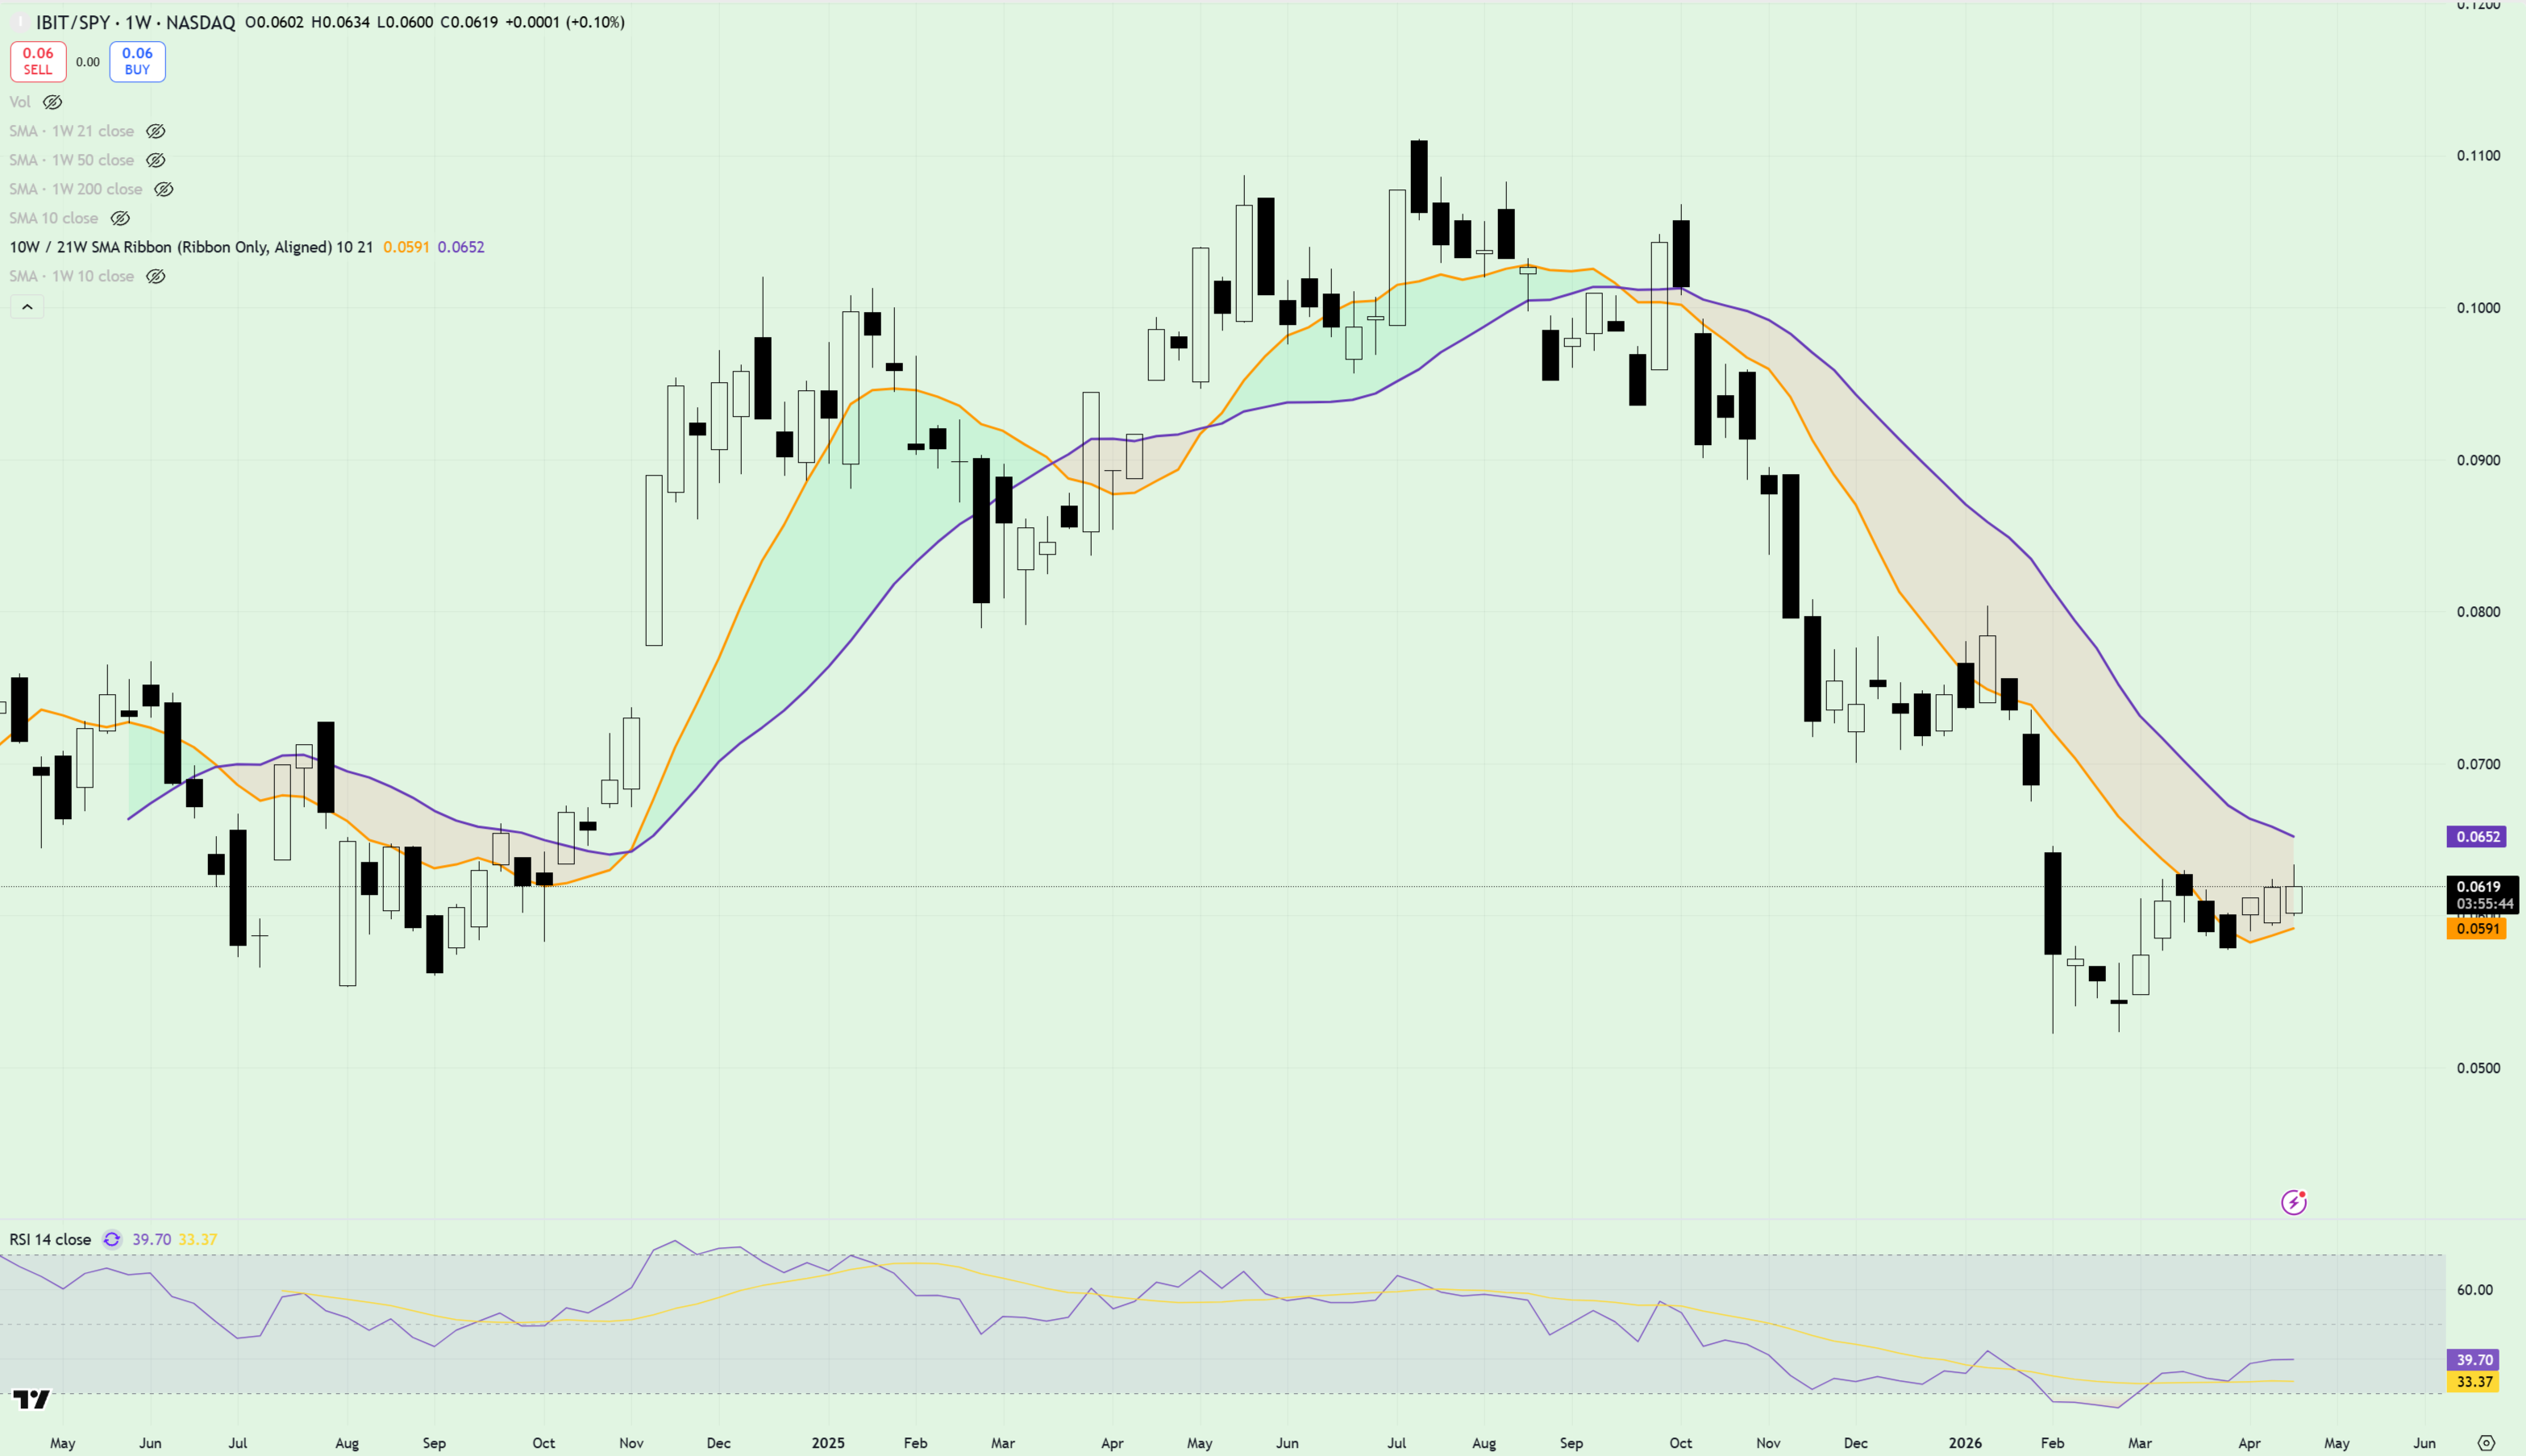
On the weekly chart, here’s how IBIT/SPY looks. Still below a declining 10/21wma ribbon, despite price reclaiming the shorter term 10wma (orange line).
In my view, this signals a potential bottoming formation - but nothing more at this stage. Should we see a progressive burst higher - likely driven by Bitcoin reclaiming the key $80k level - then I’ll start to get aggressive on names like COIN and MSTR.
Until then, I’m trying to avoid front-running the move too much.
A Predictable Setup
Right now we’ve got semis closing in on 18 straight green days while the S&P 500 prints another all-time high. No shit - it’s a bull market. But just because it’s a bull market in semis doesn’t mean it’s a bull market everywhere.
As this post points out, leadership still matters when picking which trades to enter and which to avoid. It’s a stock pickers market - don’t go picking the wrong ones!
And yet despite this irrefutable truth, there’s a predictable amount of noise on X and Substack as traders hoover up calls on every speculative name going.
To be fair, it’s worked incredibly well this month.
And I won’t pretend otherwise - I’ve played more speculative tickers than usual myself. If there’s money on the table, I’m interested.
But looking ahead, I’m not leaning too heavily into anything right now.
Parts of the market are stretched, and I’d rather stay selective while some of the more overbought areas cool off.
Boring. Maybe.
But just like Ryan Gosling in that elevator scene, when the doors open, you don’t always walk out with everyone else. Sometimes a little space to think, gather your thoughts and compose yourself, is the right move to make.
Best,
Al