



As regular readers can attest, XLY has been on my radar for quite some time.
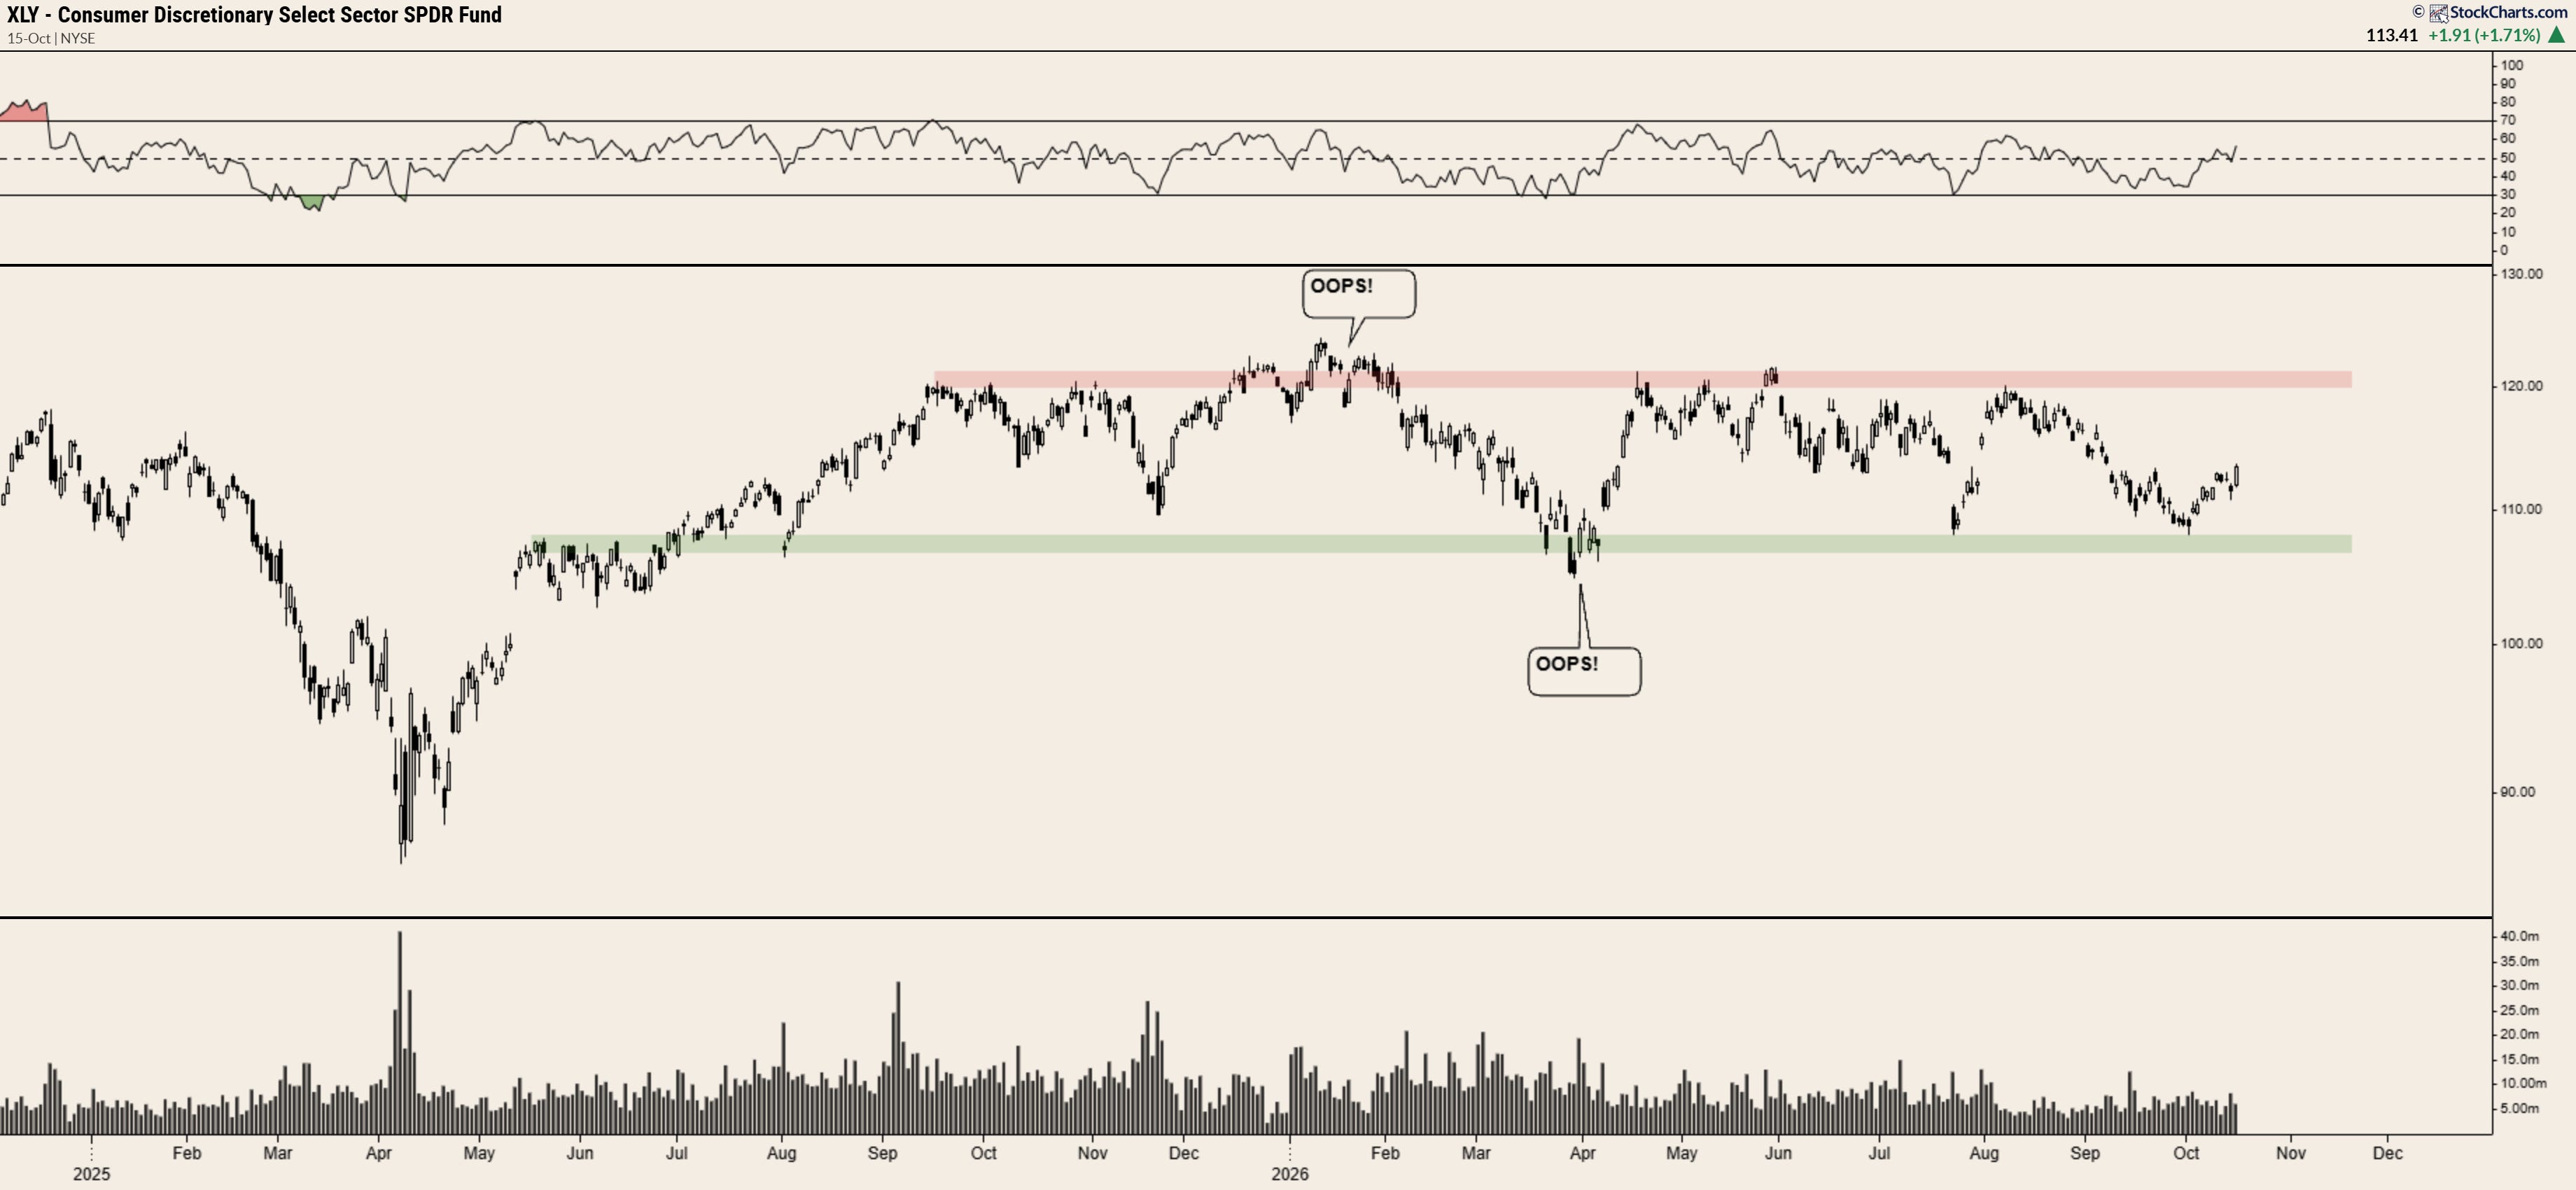
From a technical perspective, the broad range in which the ETF has traded dating back to July 2025 has made it a difficult sector to hold in one’s portfolio - especially given the incredible returns SPY and QQQ have posted over the same time period.
On a YTD basis alone, XLY currently stands around -5%, compared to +13% for SPY and +18% for QQQ. Quite the underperformance, to put it mildly.
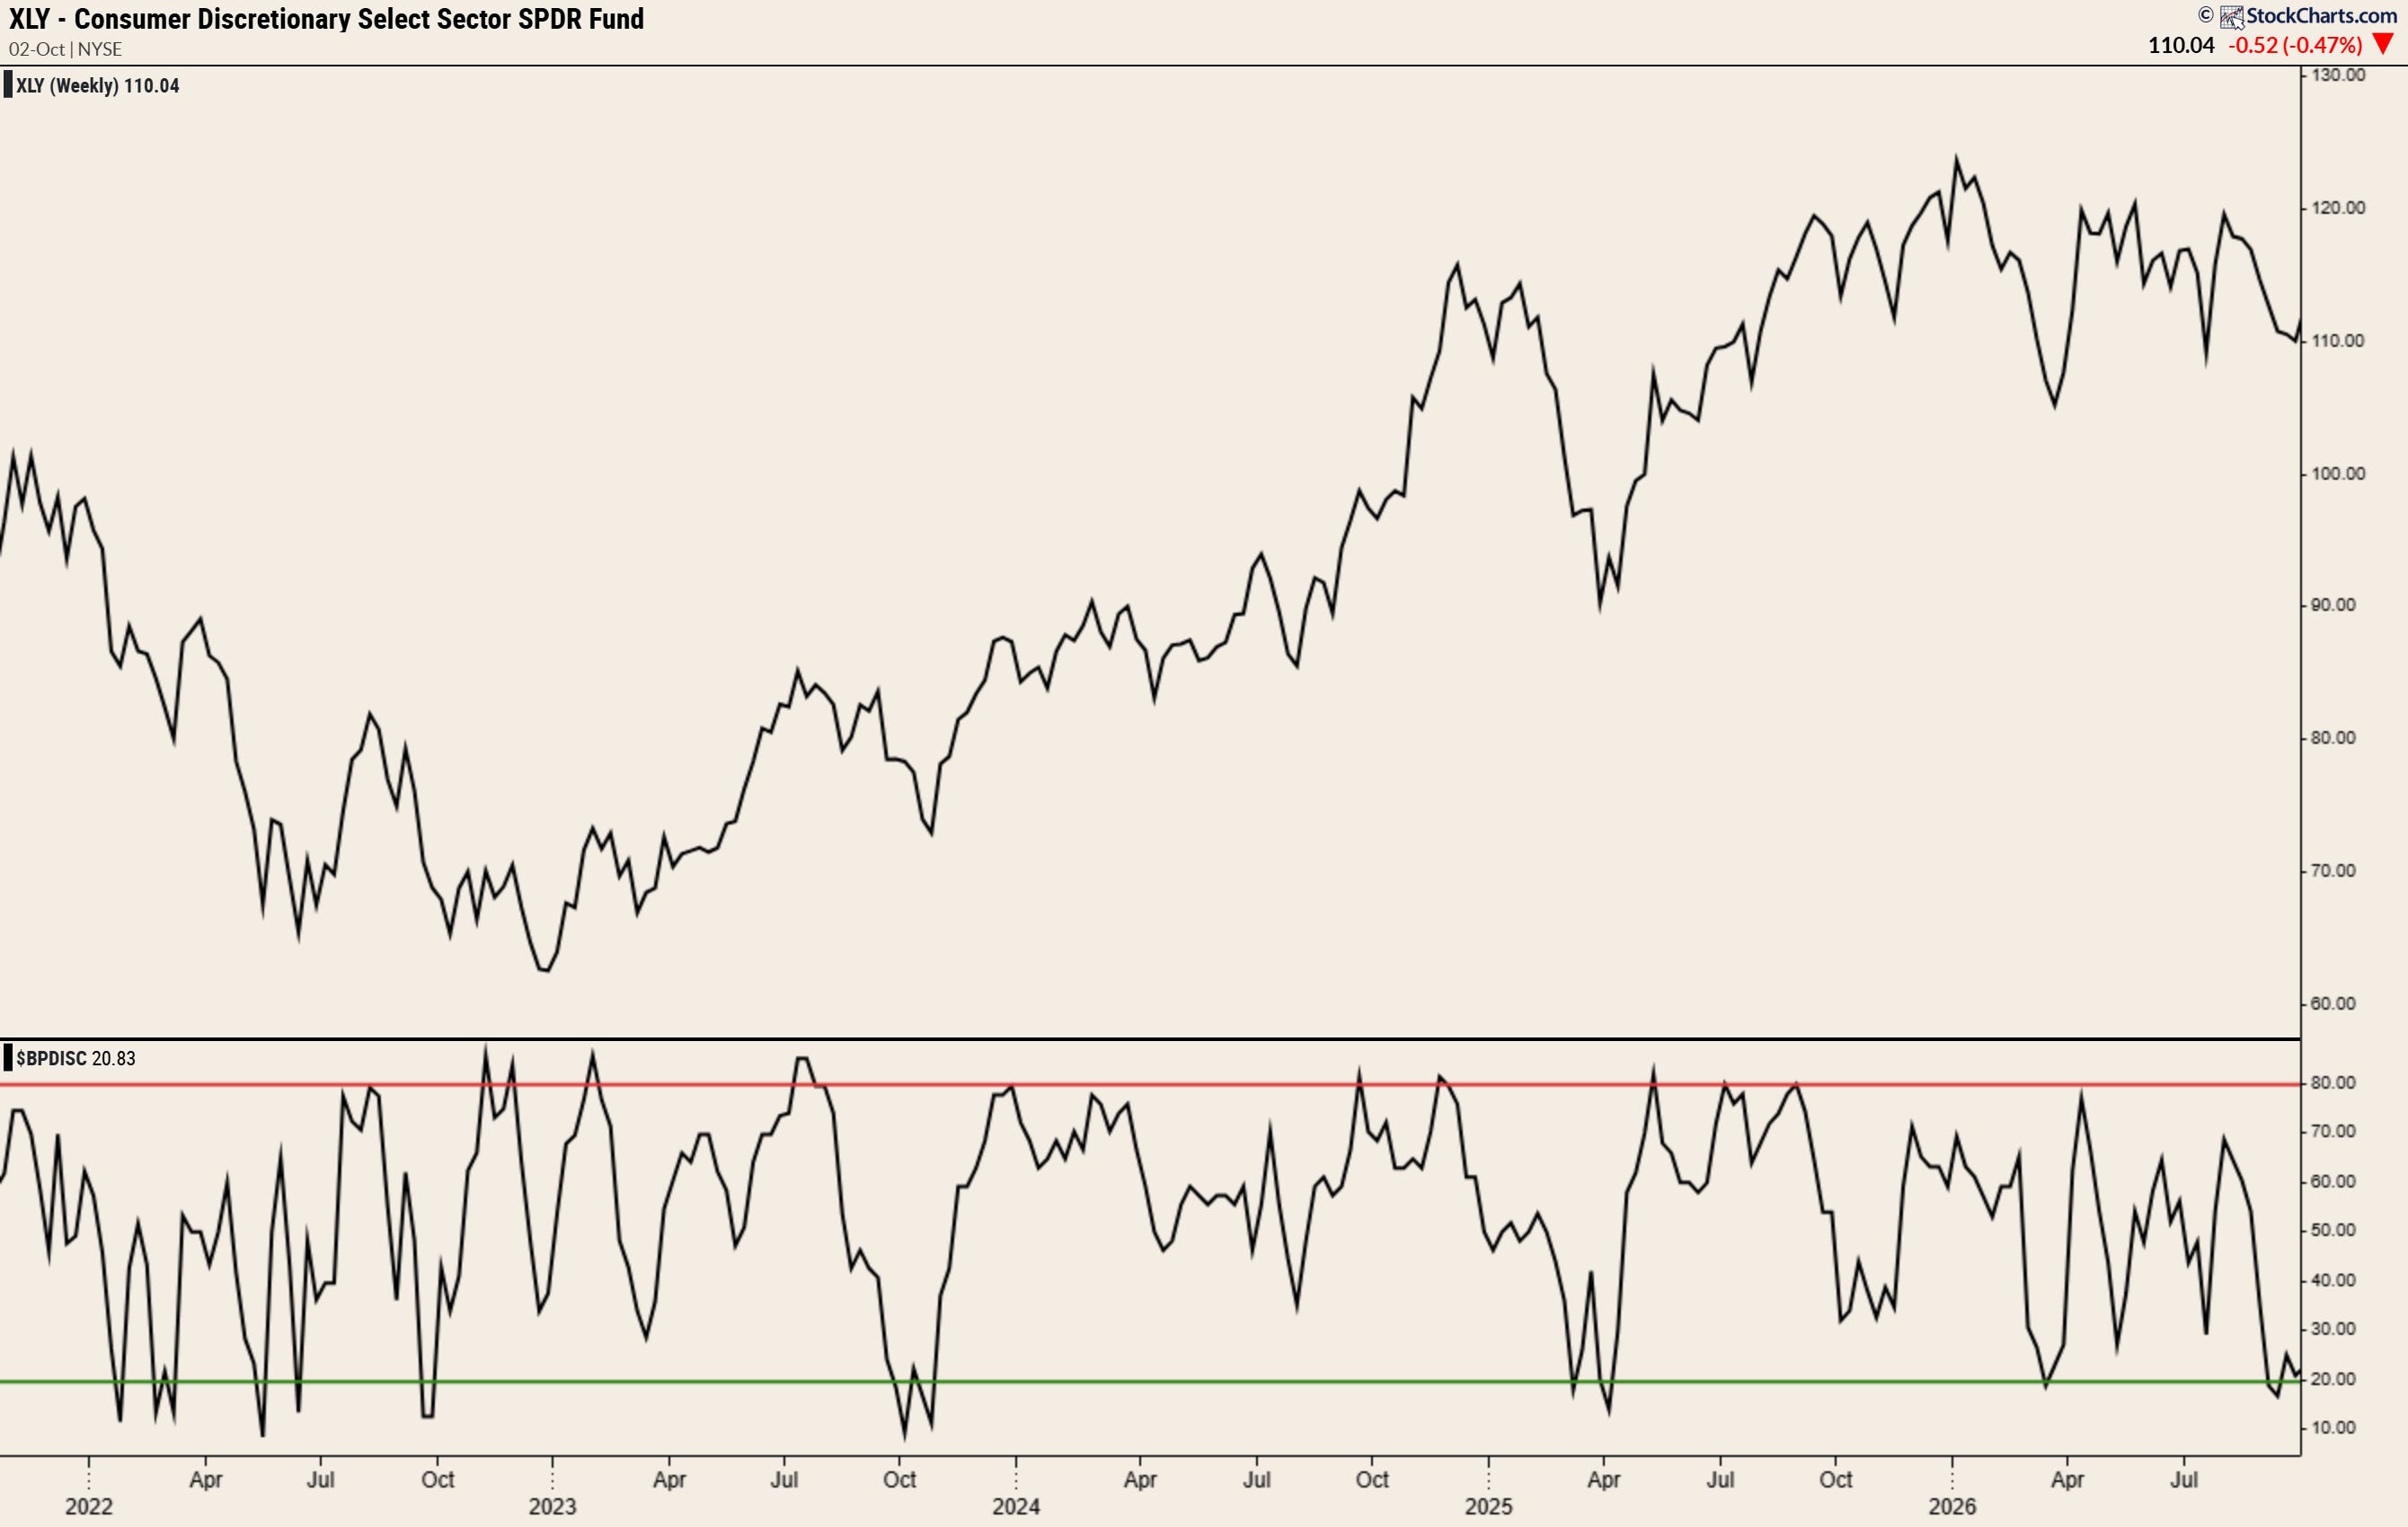
Unsurprisingly, things haven’t looked great under the discretionary hood for quite some time and, as recently as last month $BPDISC - the percentage of stocks in the Consumer Discretionary sector on Point & Figure buy signals - fell to its lowest level since April 2025.
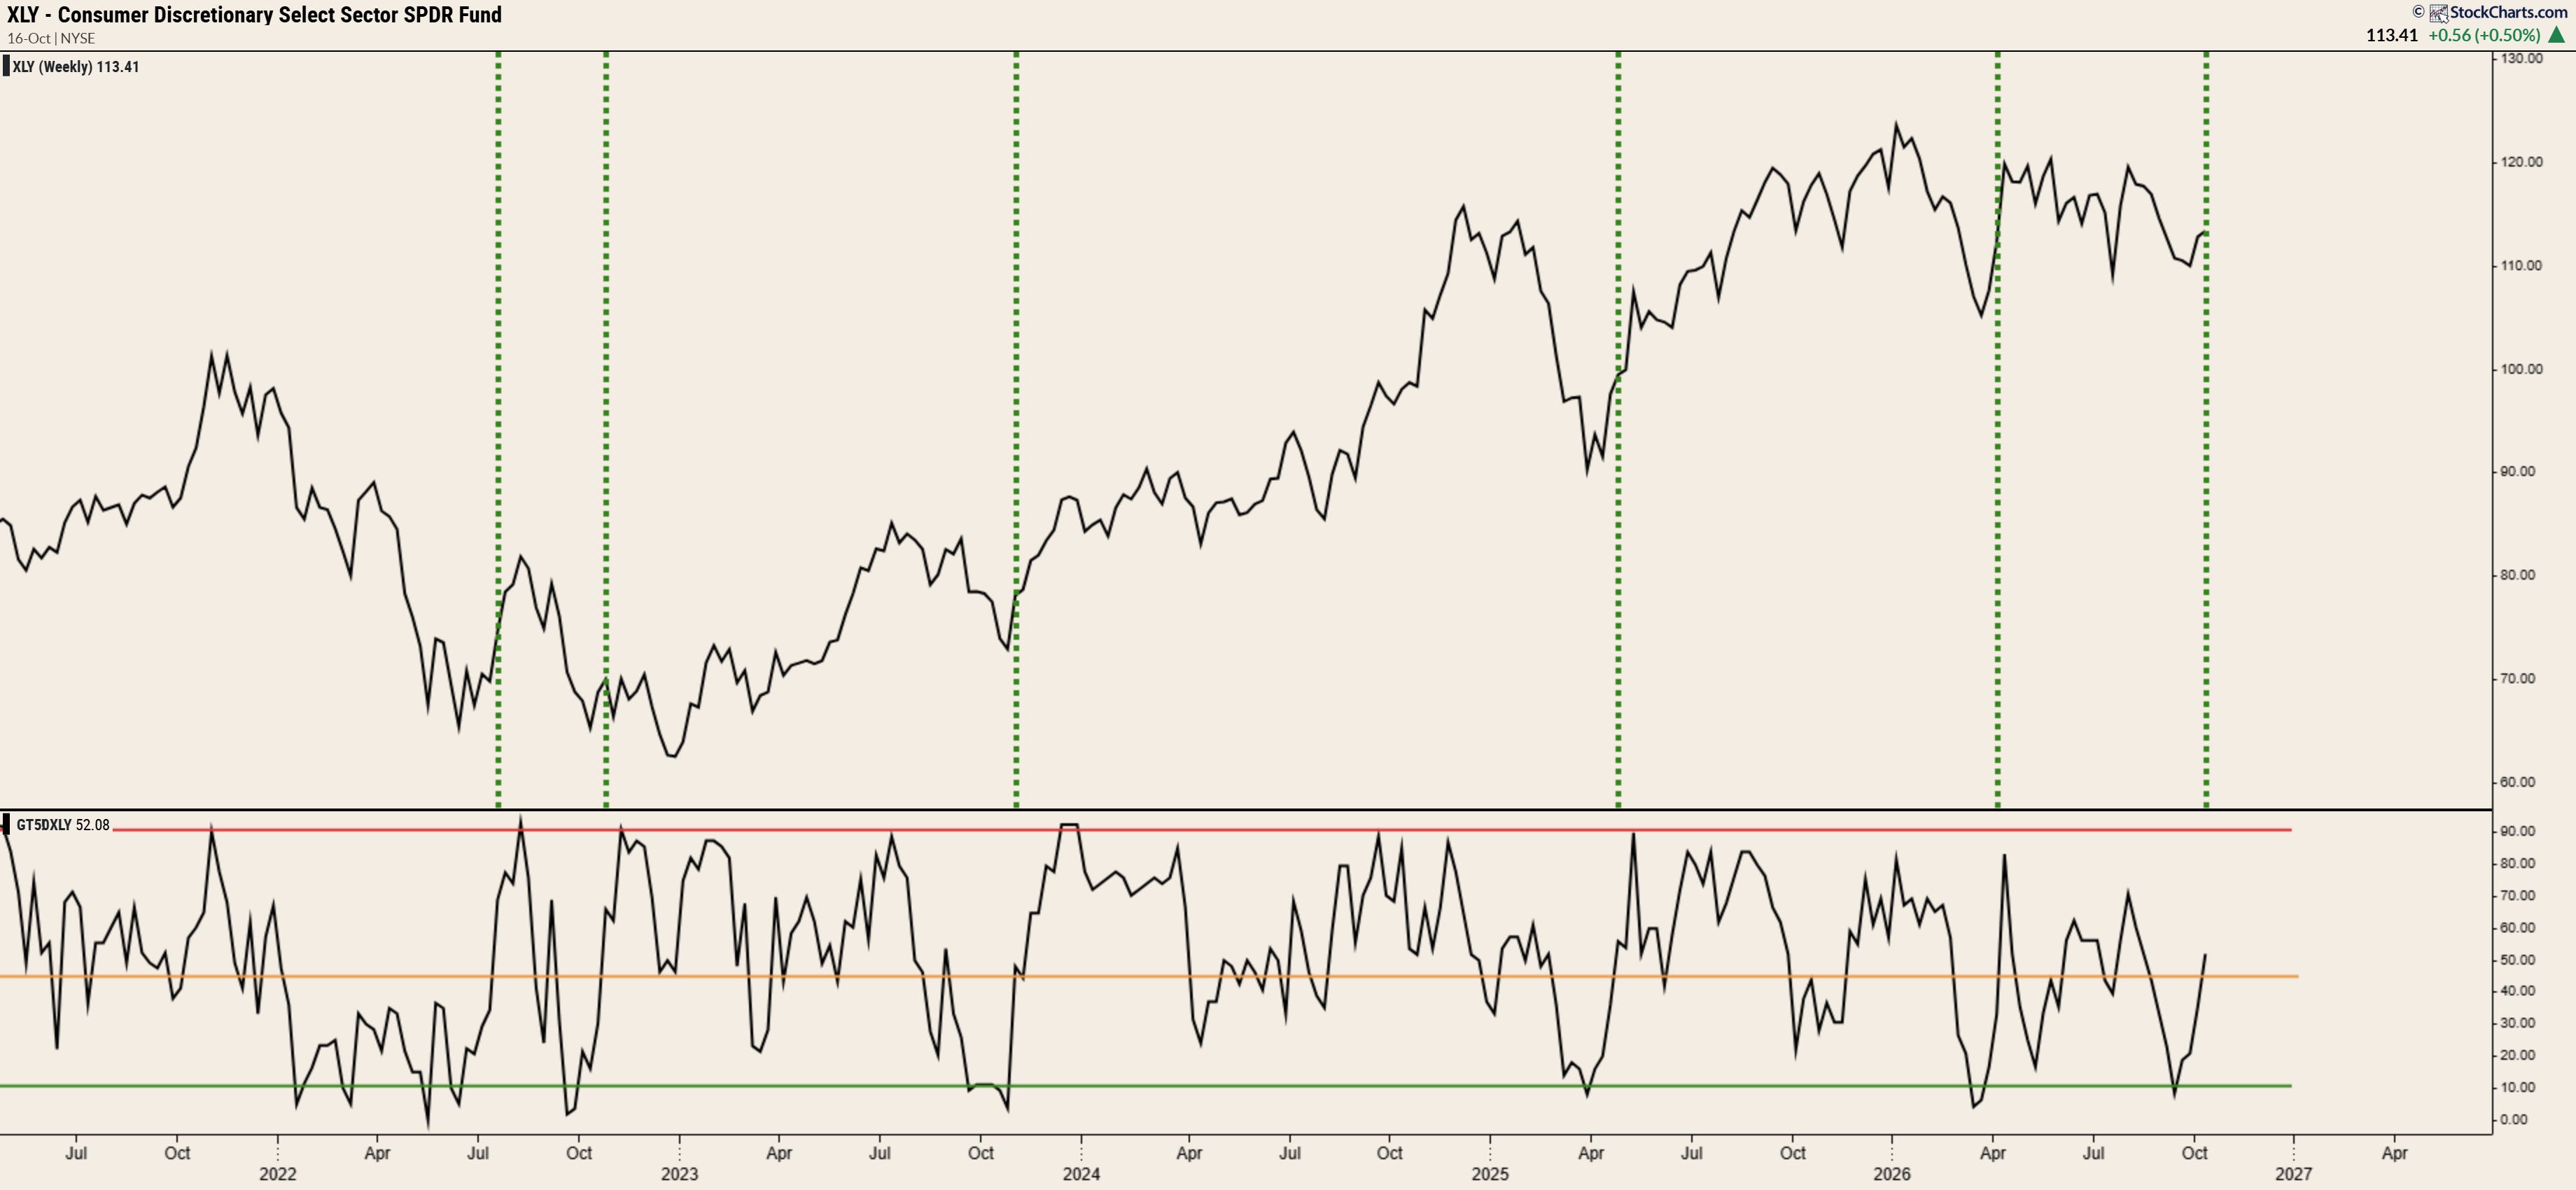
And then there’s breadth. Or should I say, a severe lack thereof…with last month showing that at the weekly close on Sept 11, less than 10% of XLY constituents were trading above their 50dma. Barf, barf and barf.
In the darkness, a glimmer of light…
While the evidence above paints a pretty grim picture, I’ve been digging into historical data and stumbled across a simple study that suggests XLY’s fortunes might be about to change.
The premise is straightforward: what happens when sector breadth stages a dramatic recovery? Specifically, I looked at every instance where the percentage of XLY constituents trading above their 50-day moving average (!GT50XLY) surged from below 10% to above 50% within 30 days or less.
In other words, periods when breadth went from downright dreadful to demonstrably healthier in a relatively short space of time. Here’s how such instances appear when overlaid onto the chart, dating back to 2022.
But the chart only tells part of the story. To get a better handle on what these breadth thrusts have meant historically, I extended the study back to 2007 and calculated XLY’s forward returns following every qualifying signal across a range of timeframes - from one week and one month through to six and 12 months.
The aim was simple: to establish whether these sharp recoveries in breadth have tended to precede further gains, or whether they’ve amounted to little more than short-lived relief rallies.
With the results spanning multiple market cycles, we have a decent sample to work with. And, as it turns out, the numbers make for some interesting reading.
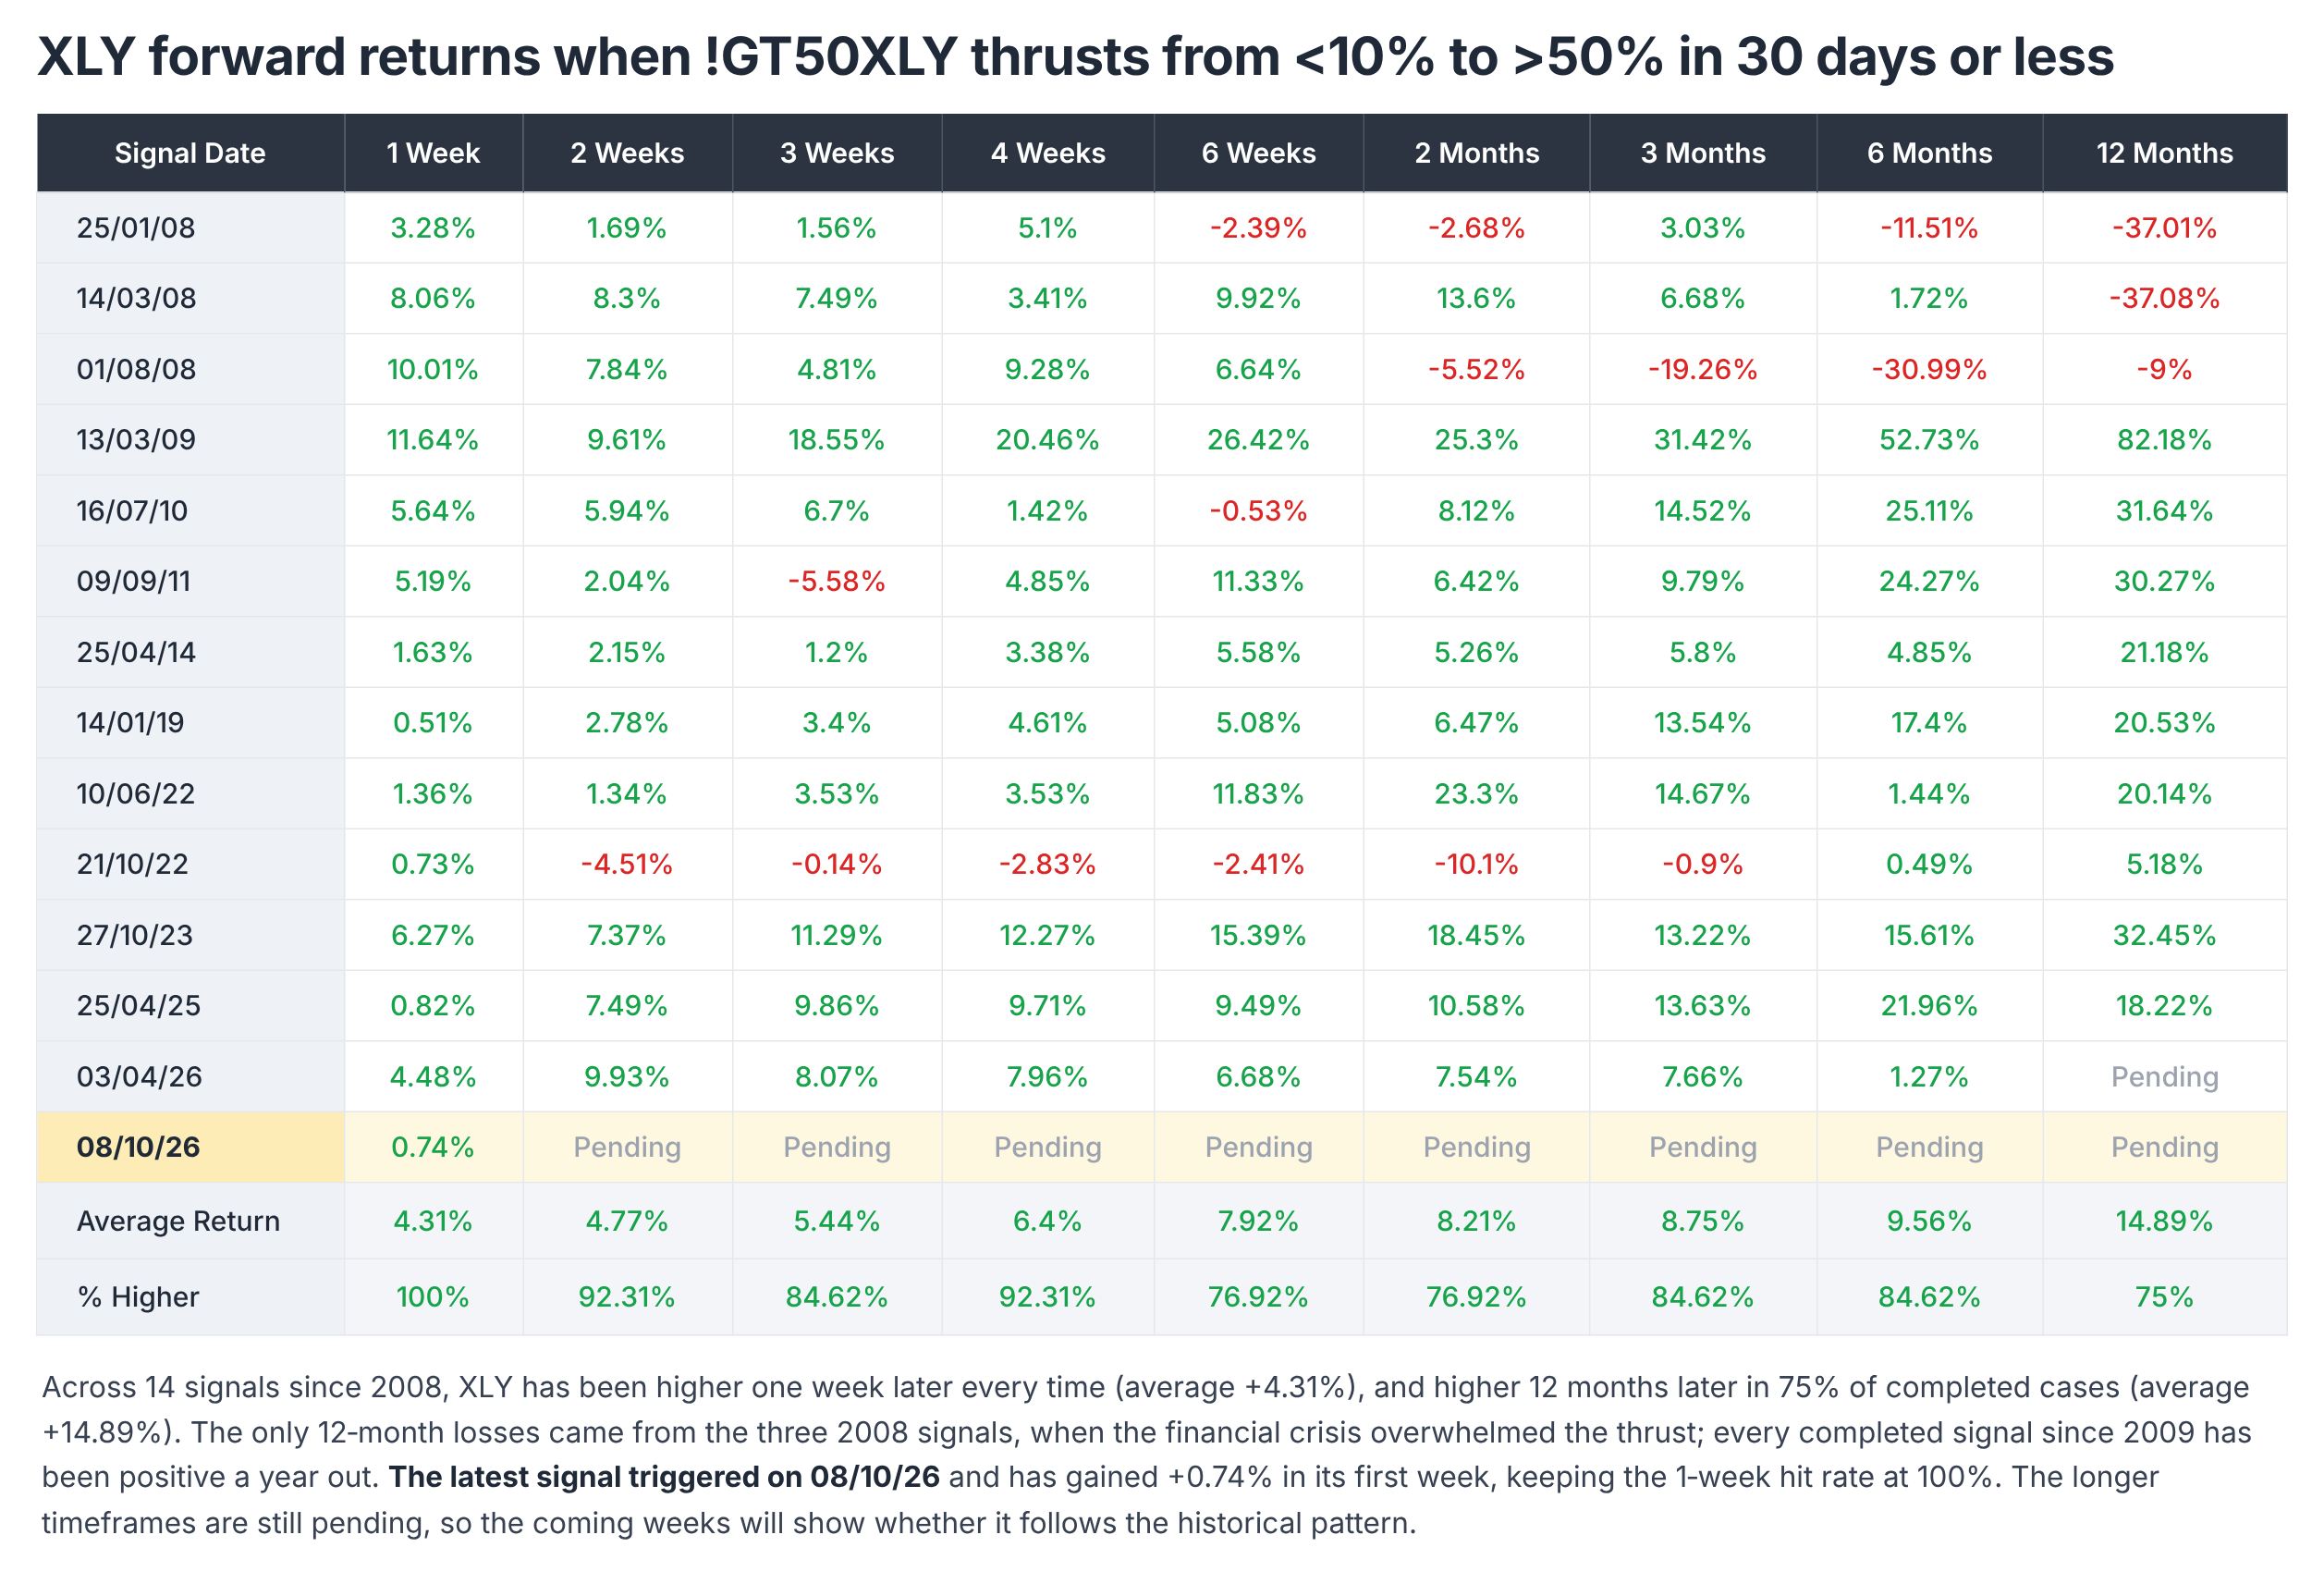
The results are certainly encouraging. One week after a signal, XLY was higher in all 13 previous instances, posting an average gain of +4.59%.
Extend that horizon to 12 months and the ETF was higher 75% of the time, with an average return of +14.89%. And perhaps more interestingly, every negative 12-month return came from signals generated during 2008 - hardly a benign market environment.
The signal has now triggered, with !GT50XLY surging from below 10% to above 50% of constituents trading above their 50-day moving average. That puts the October 16, 2026 entry firmly on the board.
Of course, a breadth thrust isn’t a guarantee of further gains, and the historical sample is hardly enormous. But with XLY’s internals showing signs of life after months in the doldrums, this is an encouraging development worth monitoring.
The next question is whether the likes of TSLA, AMZN, HD and MCD can help sustain that recovery - and whether price action finally starts to catch up with the improving breadth.
Best,
Al
Disclaimer
The information contained in this article is provided for educational and informational purposes only and reflects my personal opinions at the time of writing. Nothing here should be interpreted as financial advice, a recommendation to buy or sell any security, or a guarantee of future performance.
As always, do your own research, consider your own financial circumstances, and never invest money you cannot afford to lose. I may hold positions in securities mentioned throughout this article, and those positions may change without notice.