
Late Summer Thoughts
Bulls in Control but Warning Signs Mount


Last week I spent some time away with my family. A beautiful week spent by the sea, with the late summer sun providing the perfect climate for some lazy afternoon swims, the building of sandcastles and the occasional ice cream.
For this time of year, especially in the UK, the warm weather came as a welcome surprise. The forecast said grey skies — but the sun had other plans.
As we watched the tide roll in each afternoon, it struck me how often expectations miss reality — not just with the weather, but in life more broadly. We plan for one thing, and something entirely different unfolds.
It’s a bit like the stock market right now: everyone expected a cold front, and yet prices kept heating up. Seasonality might point one way, but as ever, markets love to make fools of forecasters.
So what does this mean moving forward? Are we set for an infinite summer that never ends, or are we best preparing for what comes down the road?
Markets, like the tides, move with rhythm — warmth followed by cold, calm followed by wind. The lesson isn’t to fear the rain, but to recognise its place in the cycle. You savour the late summer light, but you also know to gather your things before the storm rolls in.
Signs of Autumn, Creeping In
Whilst bulls remain in control, pushing major indices to new all time highs on what feels like a weekly basis, signs of summer coming to an end are starting to appear.
The best cited of these is weakening breadth:
NYSE stocks trading above their 20dma peaked in May and have been making lower highs and lower lows ever since.
Stocks trading above their 50dma peaked in July and have been locking in lower lows and lower highs ever since.
Stocks trading above their 200dma peaked in August and failed to make new highs in September whilst SPX reached new all time highs.
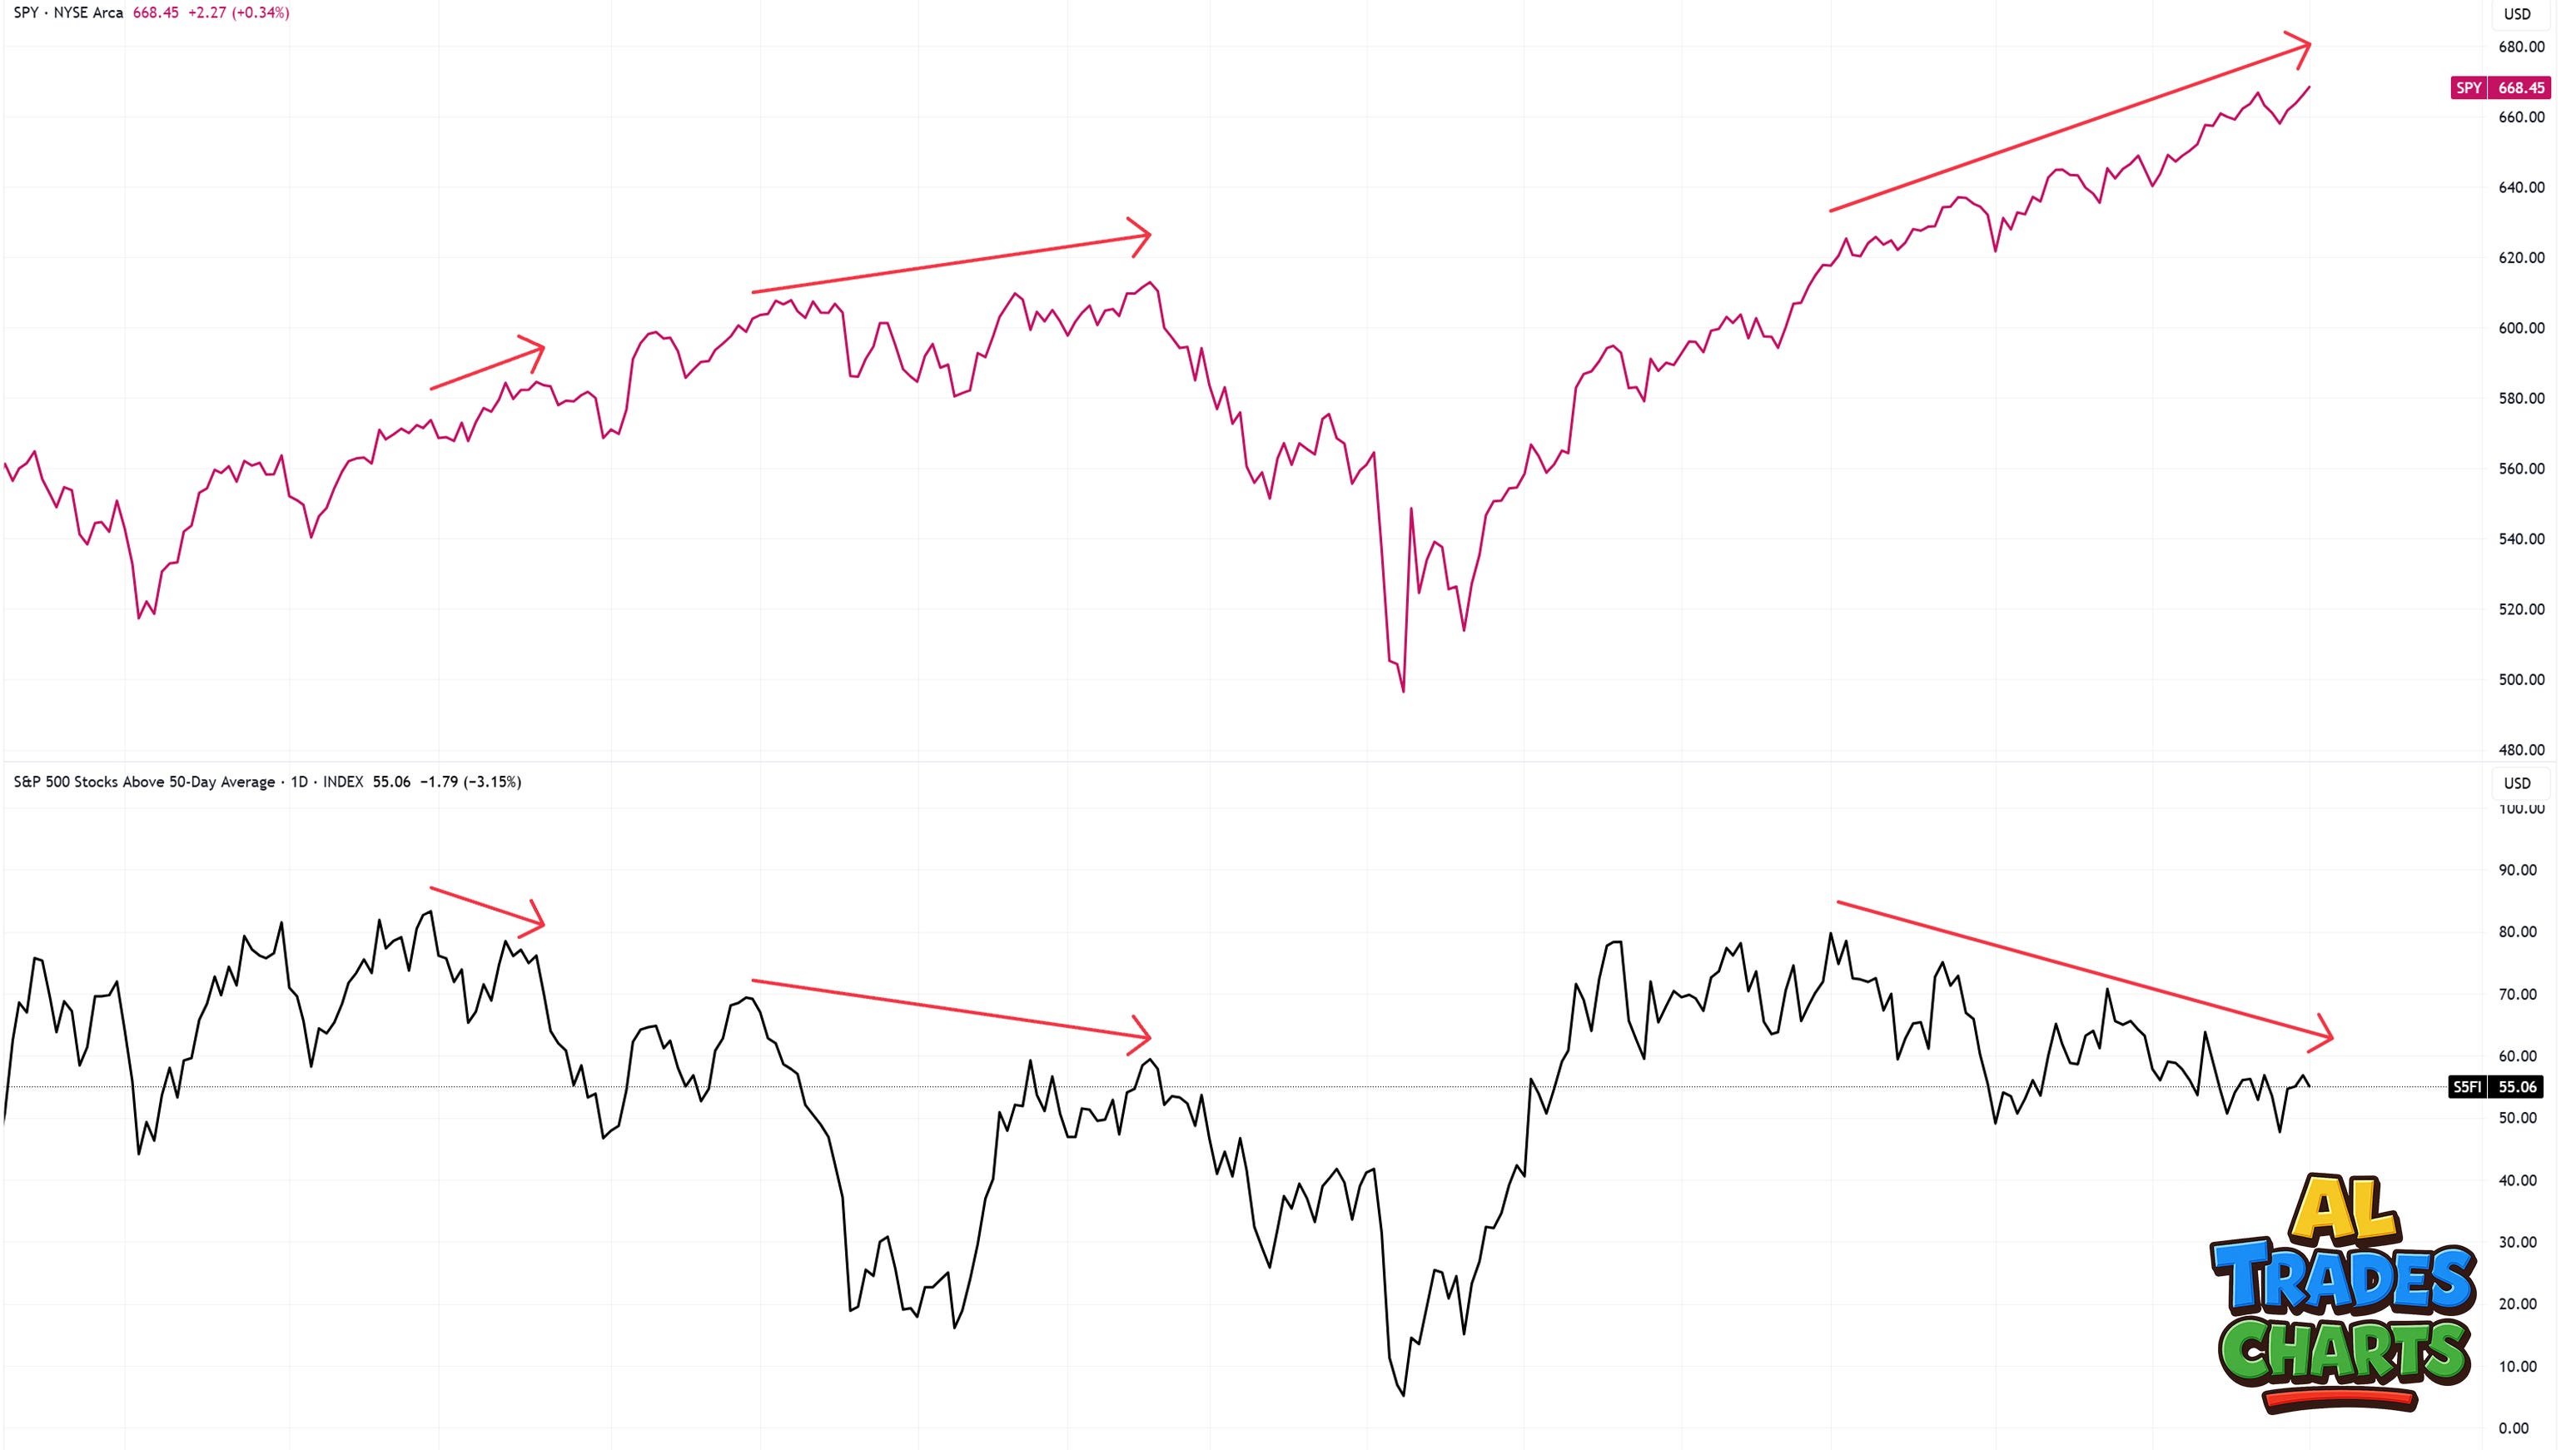
Here’s a closer look at SPY relative to SPX stocks trading above their respective 50dma. Note the significant divergence between July’s peak and September’s low relative to the SPY’s unstoppable rise.
Note also the divergence that’s been playing out between the Dow Jones Industrial Average - which recently broke to new highs - and the Dow Jones Transportation Average - which is currently failing to make new highs.
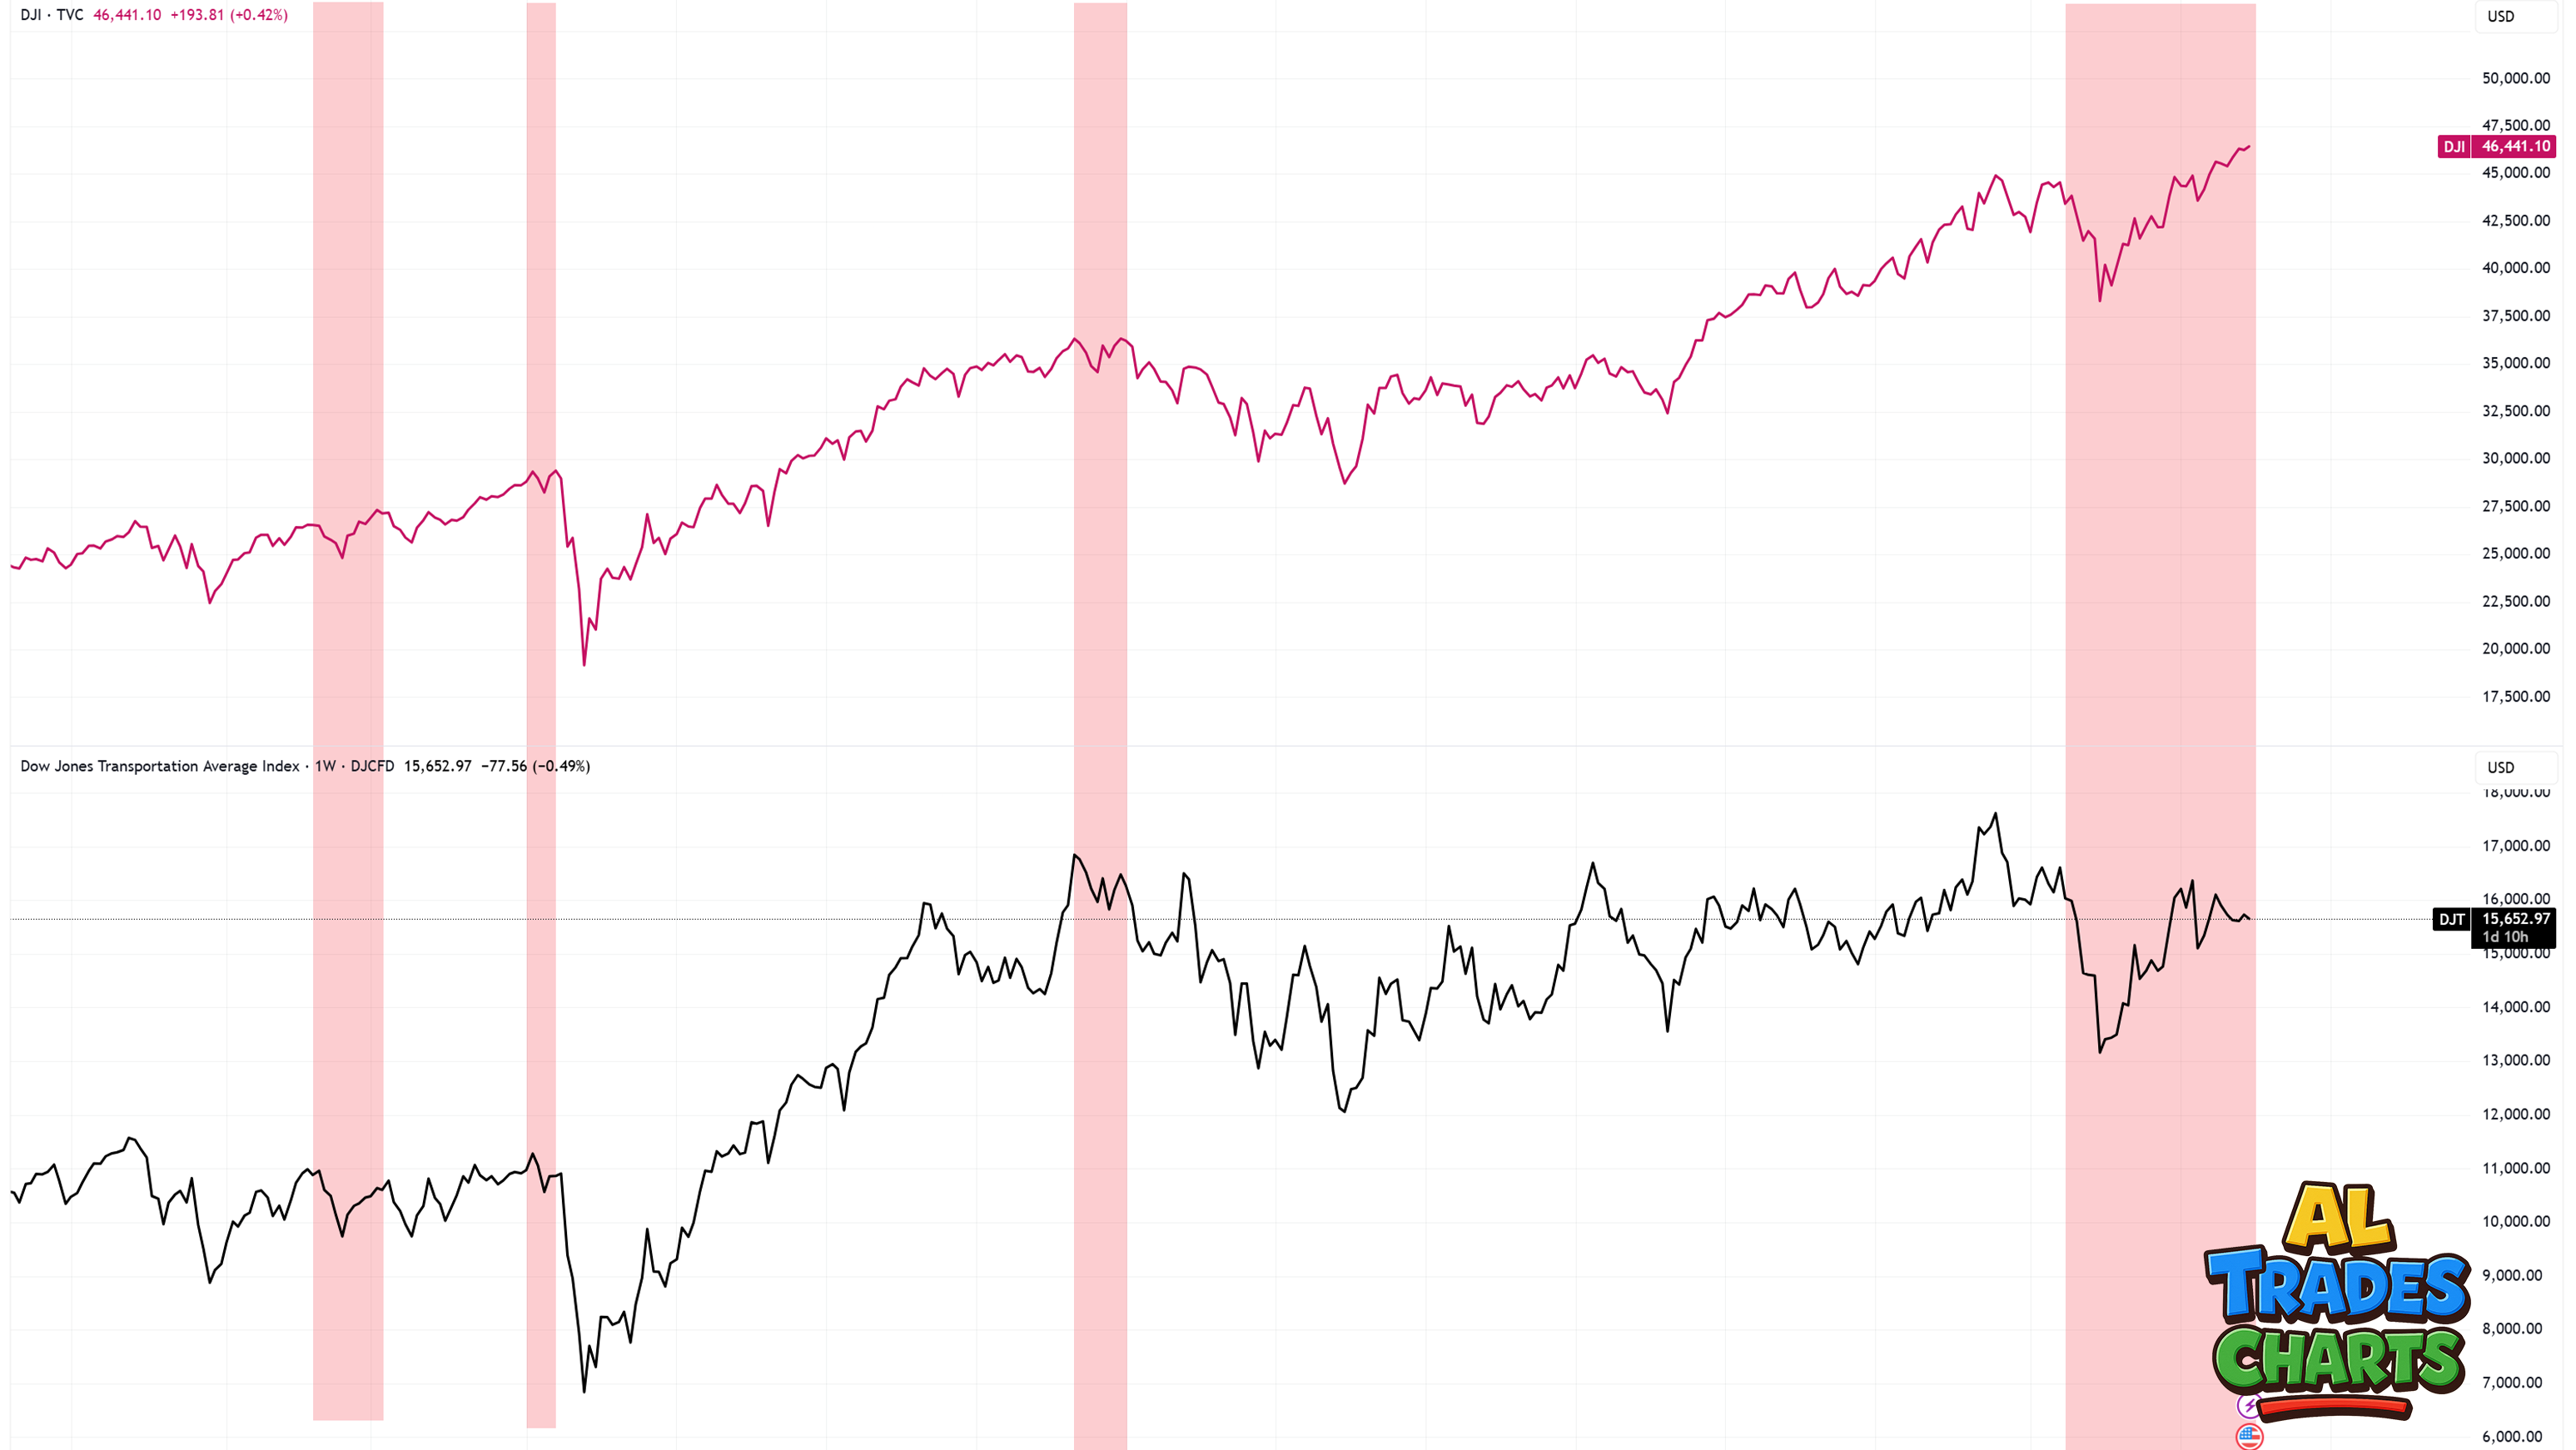
Why is this significant? According to Dow Theory, an uptrend is only confirmed when both the Dow Jones Industrial Average (top panel) and the Dow Jones Transportation Average (lower panel) move to new highs.
If one advances without the other, as is happening now, it signals a divergence—a potential warning that the underlying strength of the market rally may be weakening.
Need another divergence? How’s about SPY (top panel) relative to KRE (lower panel):
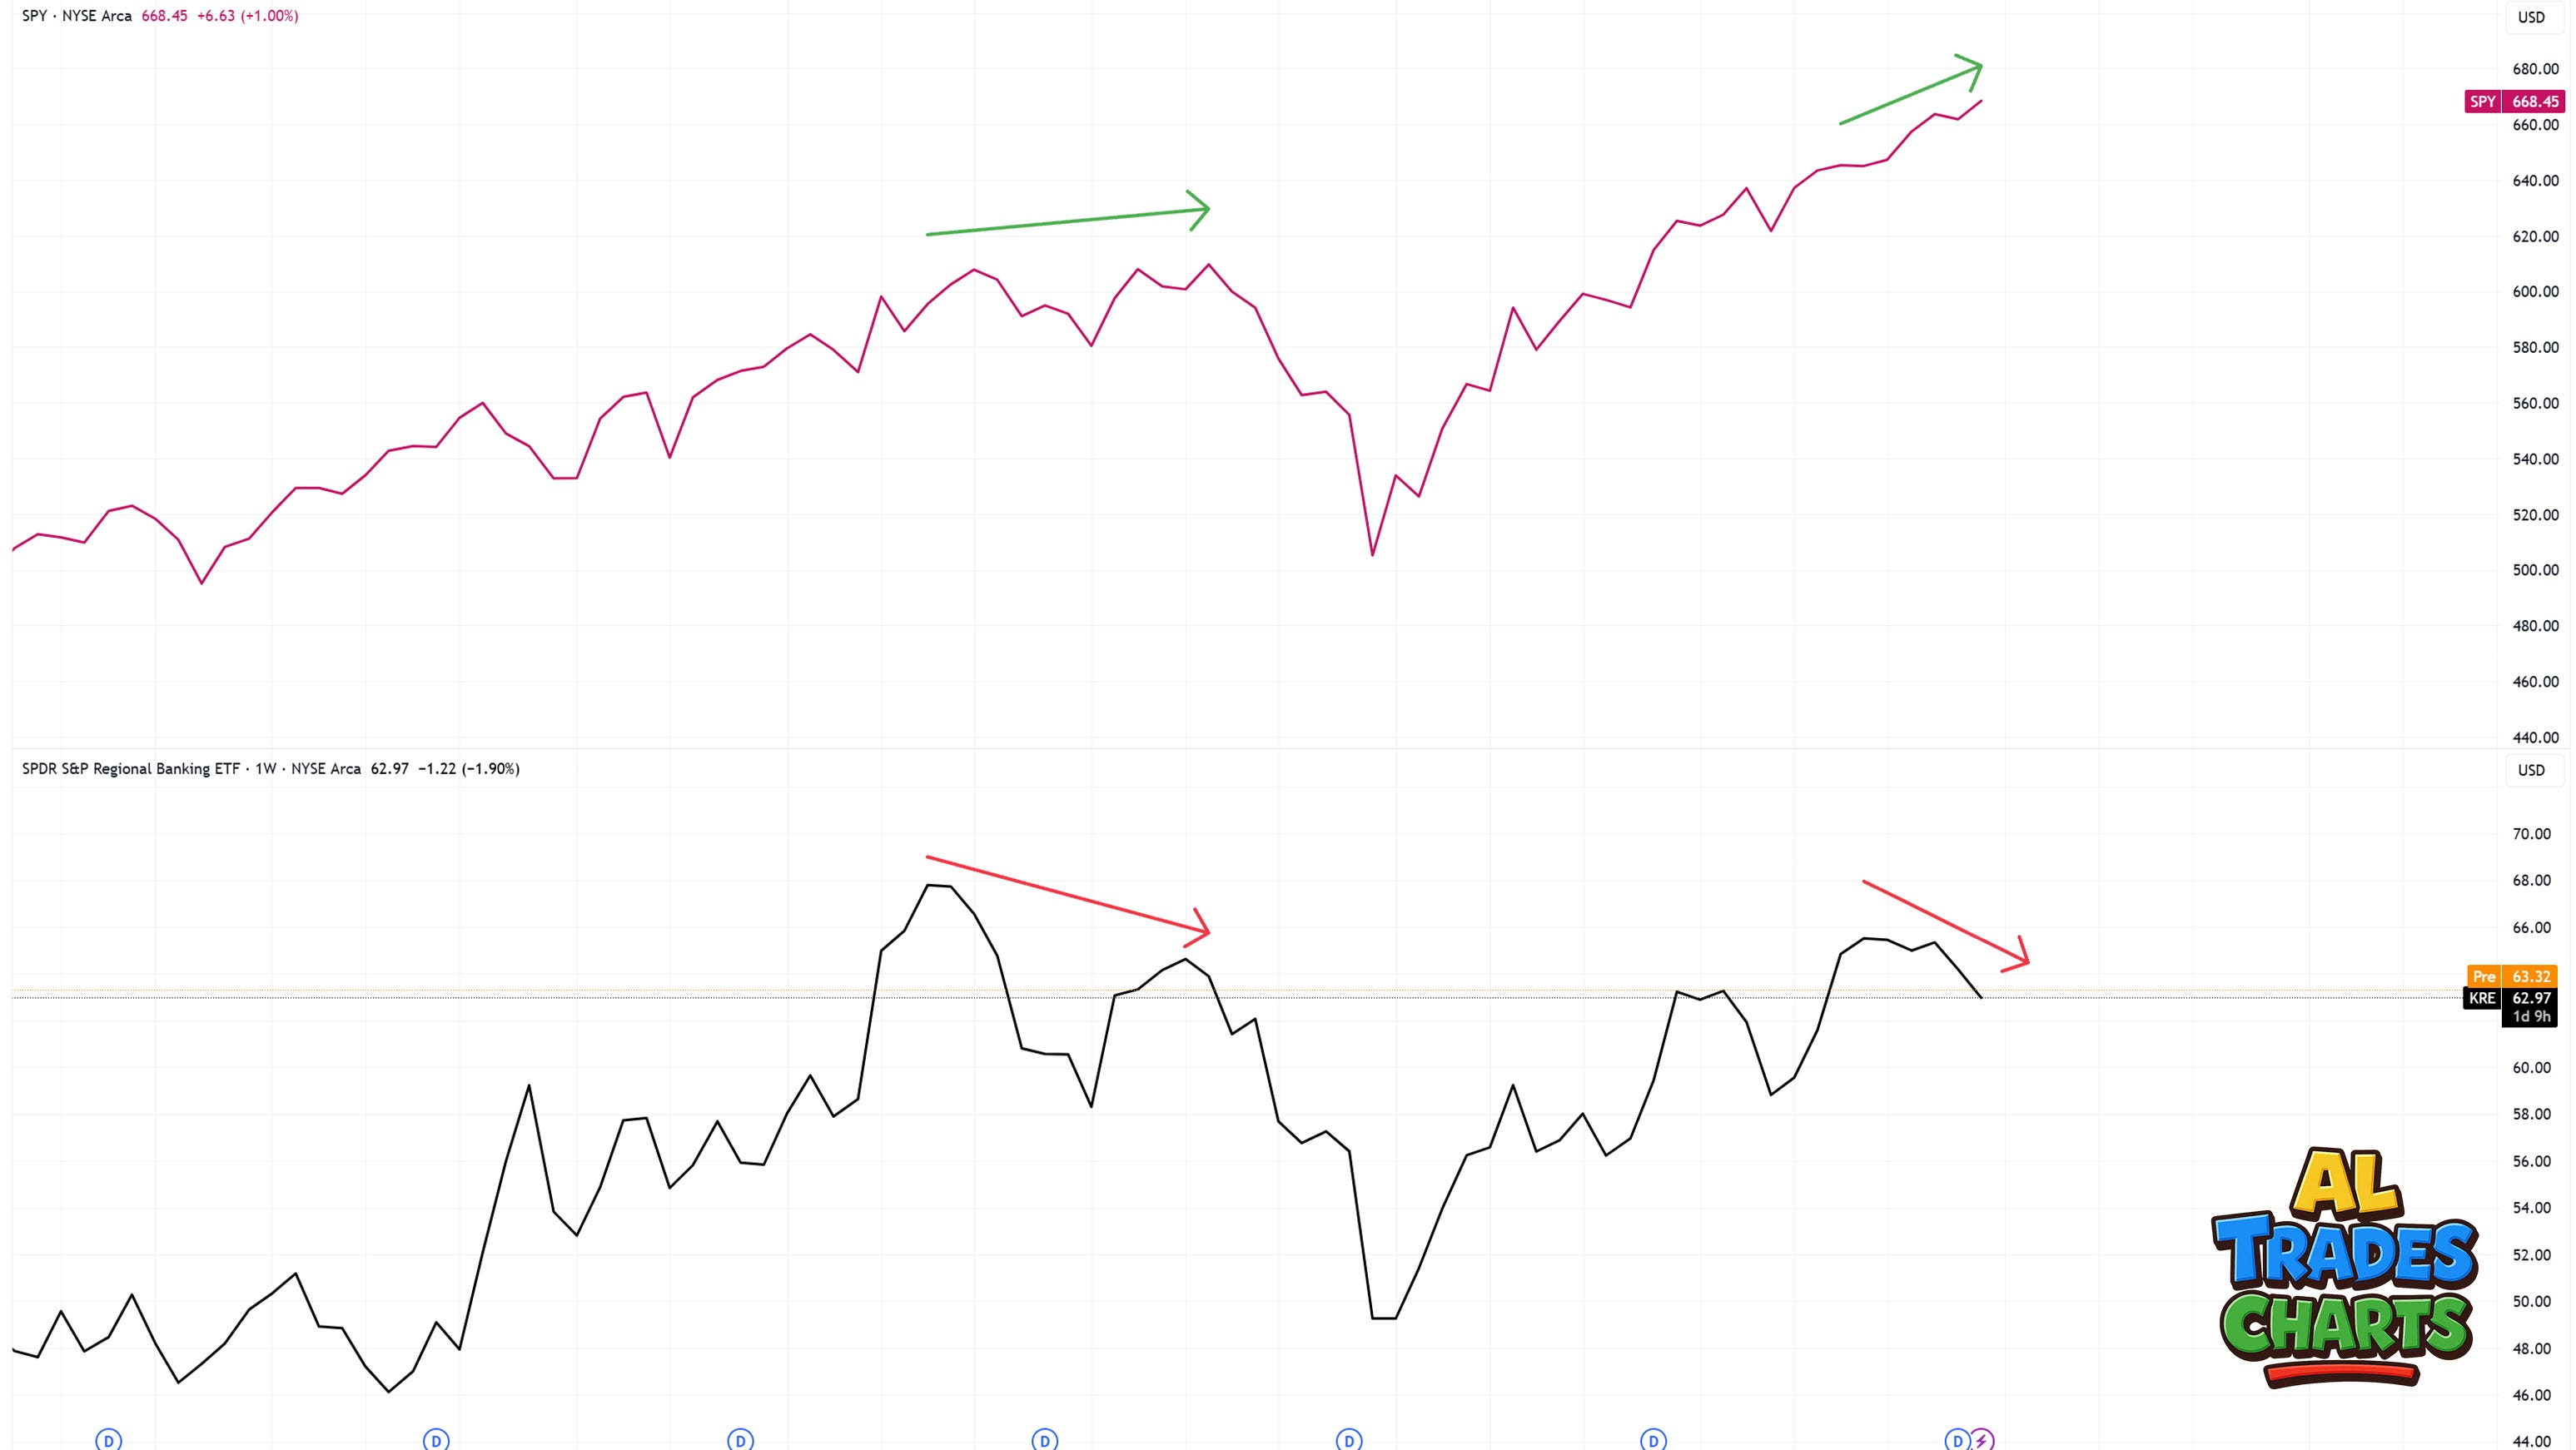
This divergence matters because it hints that beneath the surface strength of the S&P 500, key areas like regional banks aren’t confirming the move - suggesting that liquidity may be stretched under the hood. Even JC Parets — someone often labelled a permabull — has flagged this as a potential sign of underlying market weakness.
Bond Yields on the Move
The jobs market is weakening and the fed is cutting - with the short end now pricing in an October cut with near certainty, and a significant chance of one further cut before year’s end. That’s bullish, right?
When the fed cuts into strength - driven by waning inflationary pressures - as was the case in September 2024, then yes - rate cuts are typically seen as bullish. But what we’re seeing now is completely different to twelve months ago.
Inflation is ticking higher and the jobs market is under pressure. So instead of cutting into strength, it’s not illogical to conclude that the fed is now cutting into weakness, which isn’t bullish at all.
Just take a look at what happens when the 2 year collapses and its relationship with prior recessions, represented by red bars on the chart:
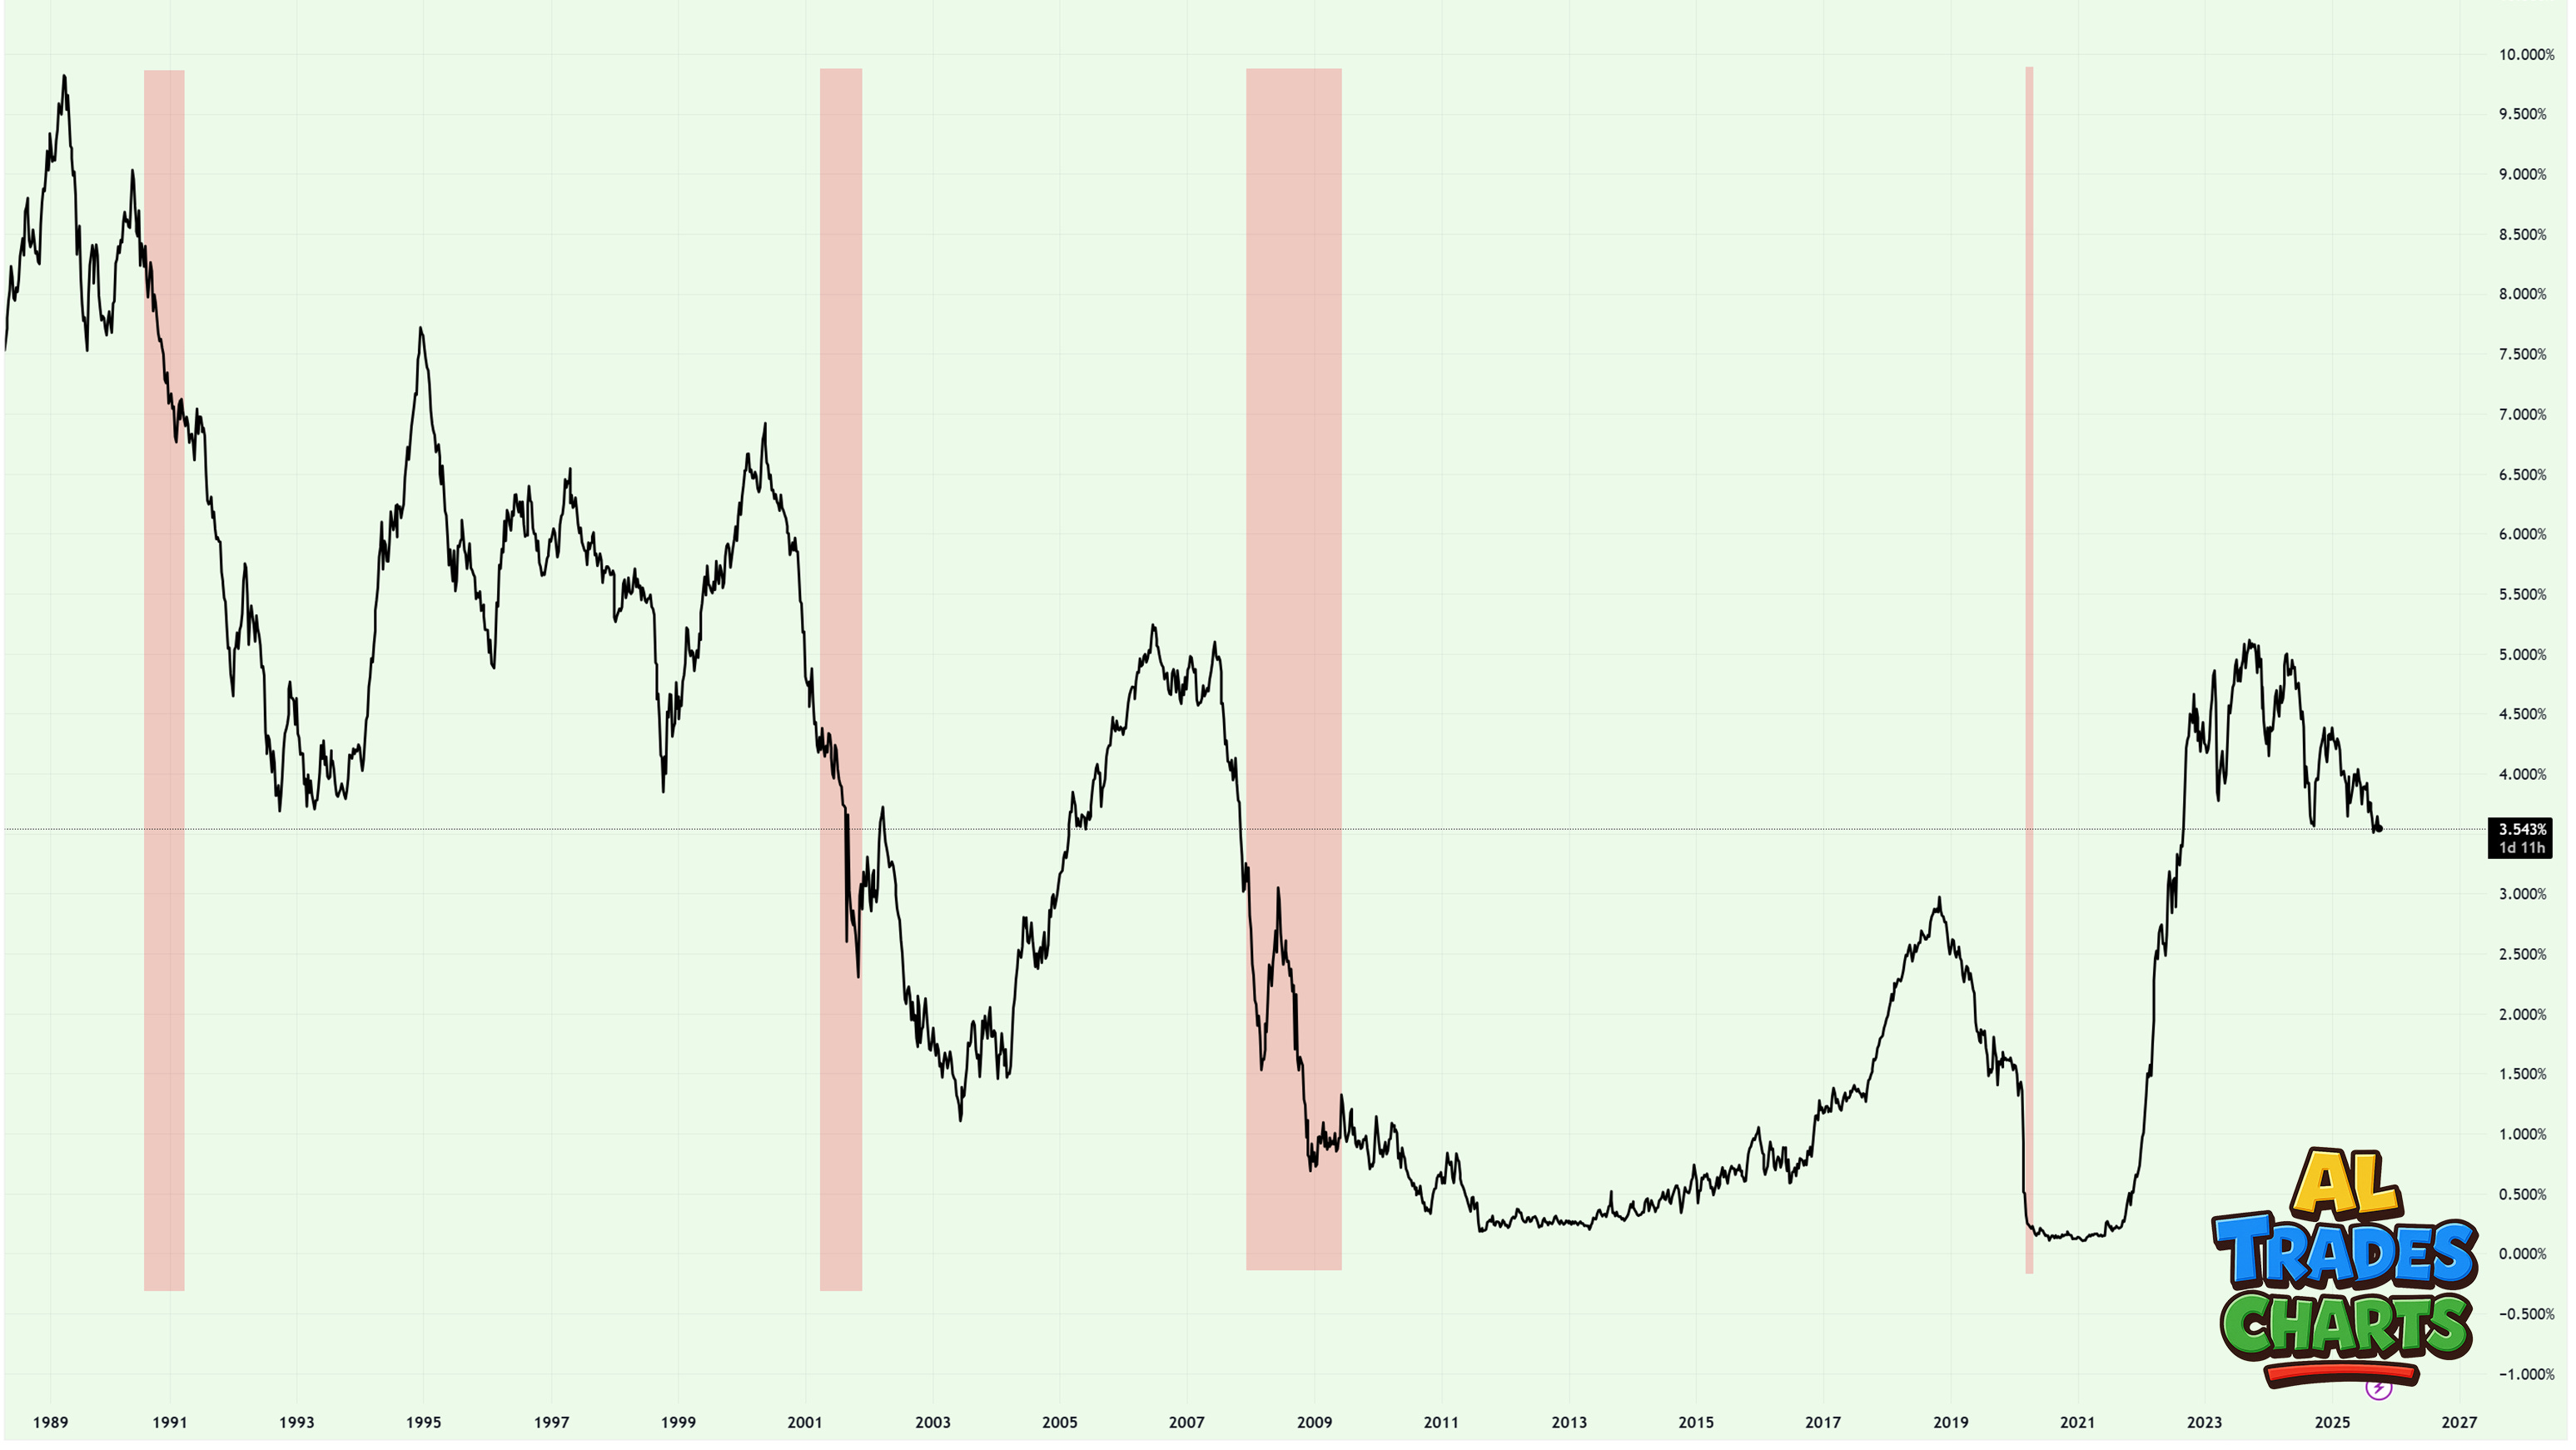
Yesterday on X I was keen to flag the deterioration in the 2 year yield as significant - as the risk here is that it confirms a collapse from what appears to be a rounded top formation. Should this continue to slide, irrespective of rate cuts, then it’d be yet another sign that the bull market that has been in play since October 2022 is nearing the end zone as traders rush for the safety of short dated bonds.
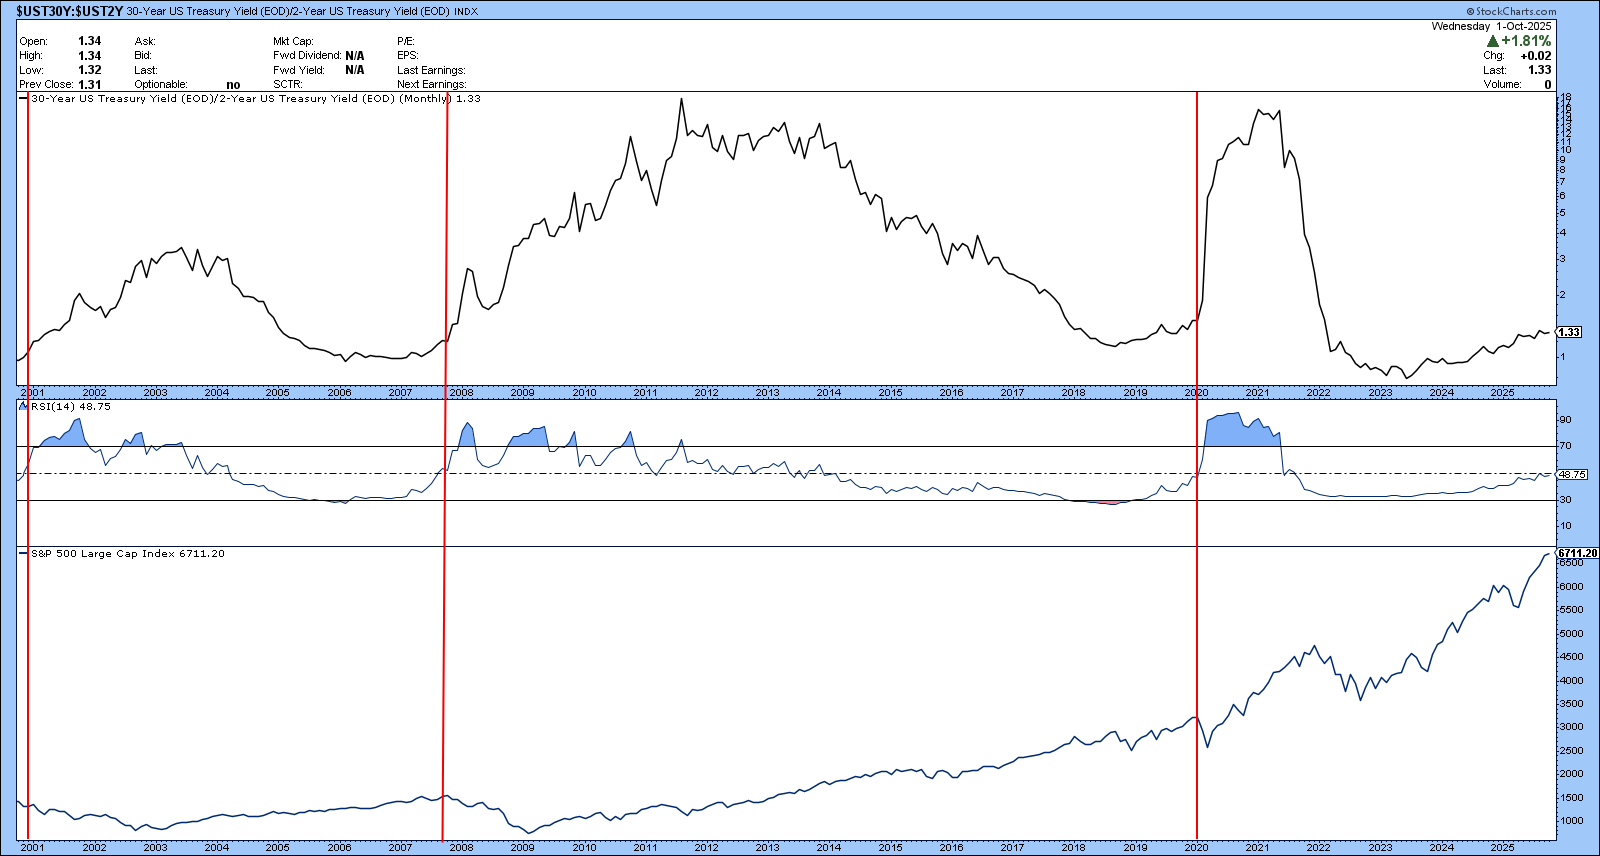
Add to this some research I concluded after seeing this post on X. What this chart shows is the relationship between the short end of the curve (2 year yield) and the long end of the curve (30 year yield) and what typically occurs when the curve steepens.
What’s significant here is the RSI.
Historically, when the RSI crosses 50 on the monthly timeframe, this has often worked as the ‘trigger’ for a broad market sell off - denoted by the red bars on the chart:
2001 - Dot Com Bubble Bursts
2008 - Subprime Mortgage and GFC
2000 - Covid19 Sell Off
We Might Not be There Yet
Whilst all these charts provide a bearish take, it’s worth noting that calling tops in this market remains a fool’s errand. I should know - the QQQ puts I bought on Wednesday are deep in the red at the time of writing.
But everything outlined in this post is worth noting. Sure, the divergences could correct and we could see KRE and DJT break to new highs. We could also see the 2 year yield gain strength instead of weakness. We could also see stocks moving above their respective moving averages and realigning with the trend.
All of these things are possible - but that’s not to say they should be ignored.
In the meantime, the trend remains strong and buyers remain firmly in control, but my bet is that the market as a whole is entering its final stages. Will it come to a head in October, November or sometime in 2026?
Nobody knows. But the sun can’t shine forever.
Best,
Alex