
Saving Private Ryan
“We’re not here to do the decent thing. We’re here to follow orders.”


War is hell, as the saying goes.
It’s a sentiment stock market bulls have come to understand all too well ever since Trump launched his Iranian “expedition” on February 28 - with the effects rippling across markets faster than a tracer across Omaha Beach.
Which is why Saving Private Ryan feels like the perfect metaphor for this week’s tape.
Not just because of the chaos. Not just because of the rumors of an amphibious invasion. But because until the smoke clears, nobody knows what the next phase looks like.
But just as Captain John Miller had a map to guide him through the next phase of the mission, we’re navigating this battlefield with charts.
And in environments like this, the smartest traders aren’t charging the beach - they’re reading the terrain before taking the next step.
Commodities Lead, Bonds Follow
Whether you’re looking at UK Gilts, German Bunds or US Treasuries, bond vigilantes are sending a clear message: growth fears are real, inflation jitters are creeping back, and the idea of imminent rate cuts is being quietly pushed further out of reach.
Put simply, the bond market isn’t buying the soft-landing narrative right now, which isn’t surprising given the surge in oil prices over the last few weeks.
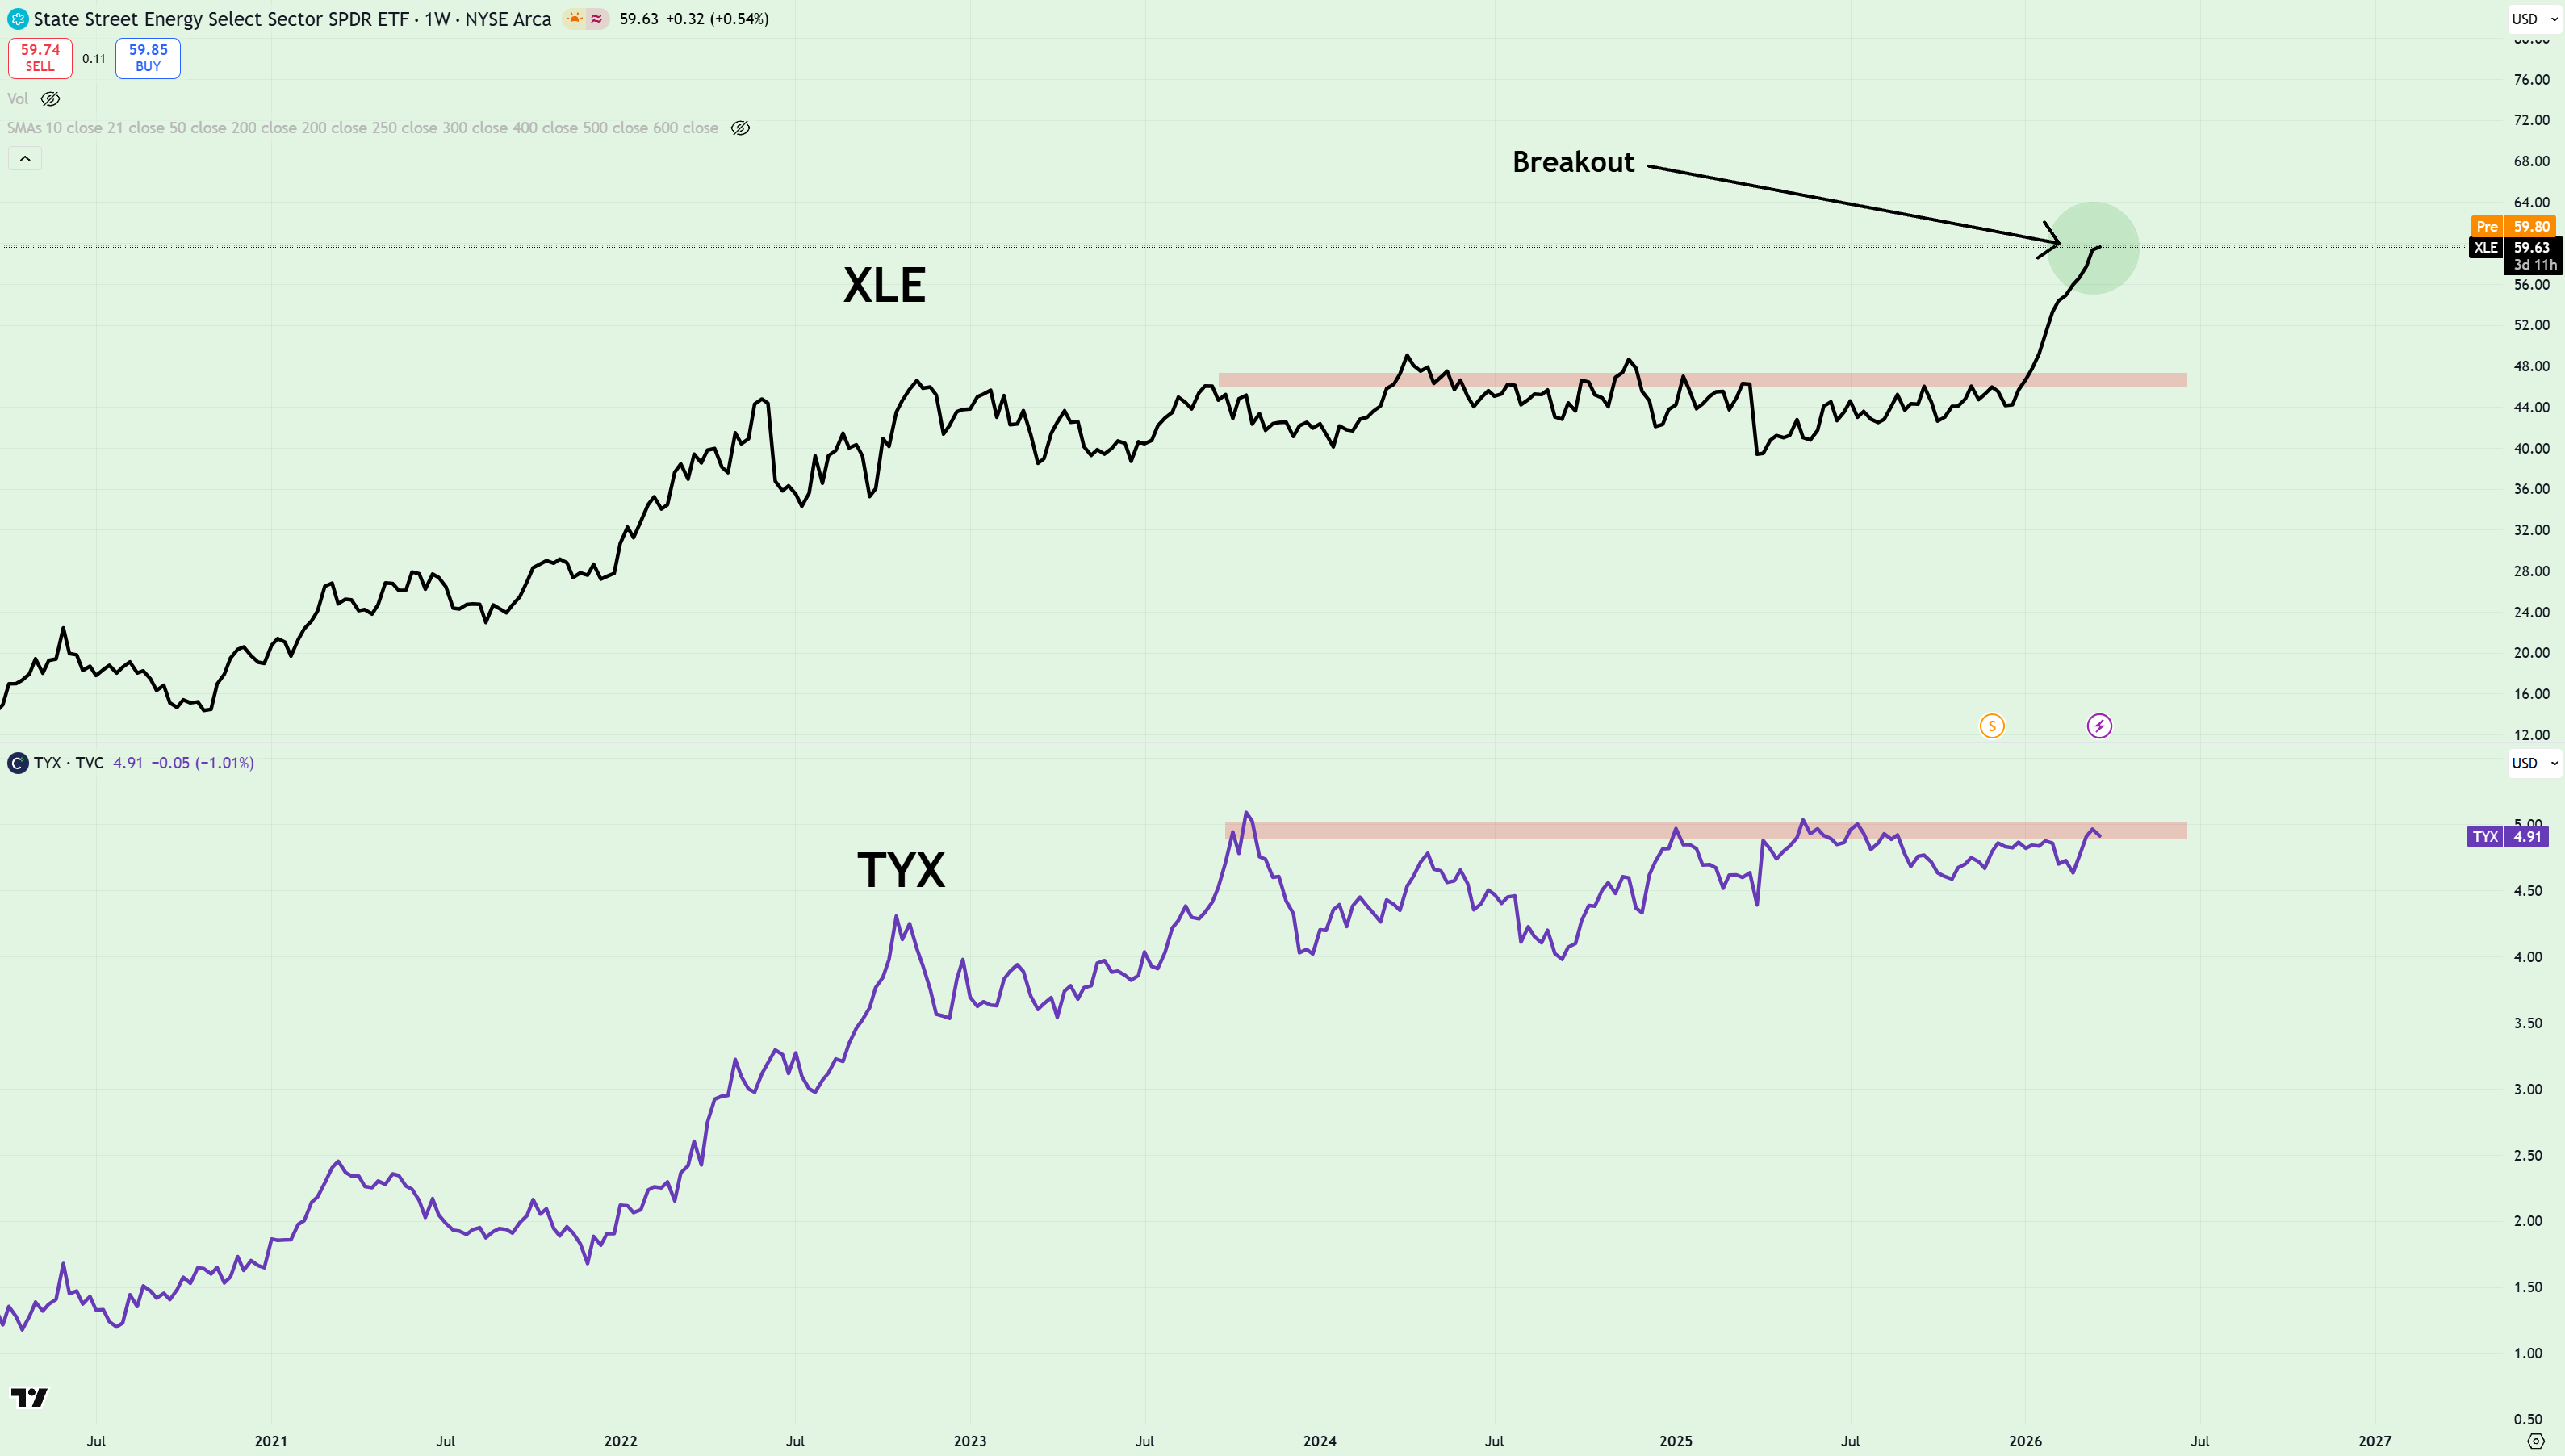
Take note of how TYX - which tracks the yield of the 30-year US Treasury - has broadly moved in tandem with XLE over the past few years.
Sure, not quite in lockstep. But the setup looks clear to me: after consolidating for the best part of two years within a tight range, XLE has now broken out to fresh all-time highs.
Should TYX follow suit, it’s difficult to imagine a scenario in which equities remain unscathed. Because structurally higher long-term yields don’t just reflect stronger growth expectations, they also reflect tightening fiscal conditions.
Mortgage rates rise. Corporate borrowing costs increase. Valuations compress. And suddenly the discount rate investors use to justify premium multiples starts moving in the wrong direction.
In other words: what’s bullish for energy isn’t necessarily bullish for the broader market. And if oil continues to climb, don’t be surprised to see bonds follow and equites suffer.
Trade idea: short TLT, short IWM, long precious metals
The Case for Negotiation
Given that we’re heading into a Midterm year - one that could seriously threaten the durability of a Trump presidency if Democrats regain congressional control - the moves we’re seeing in the bond market provide a clear incentive for the administration to change course.
Put simply, higher gas prices, rising mortgage rates and tighter borrowing conditions - all likely outcomes if commodities continue climbing alongside yields - run directly counter to Trump’s pledge to bring the cost-of-living crisis under control.
And if that promise starts to unravel, the Midterms risk becoming less of a referendum on policy… and more of a bloodbath for the administration.
Which brings us to Monday’s TACO.
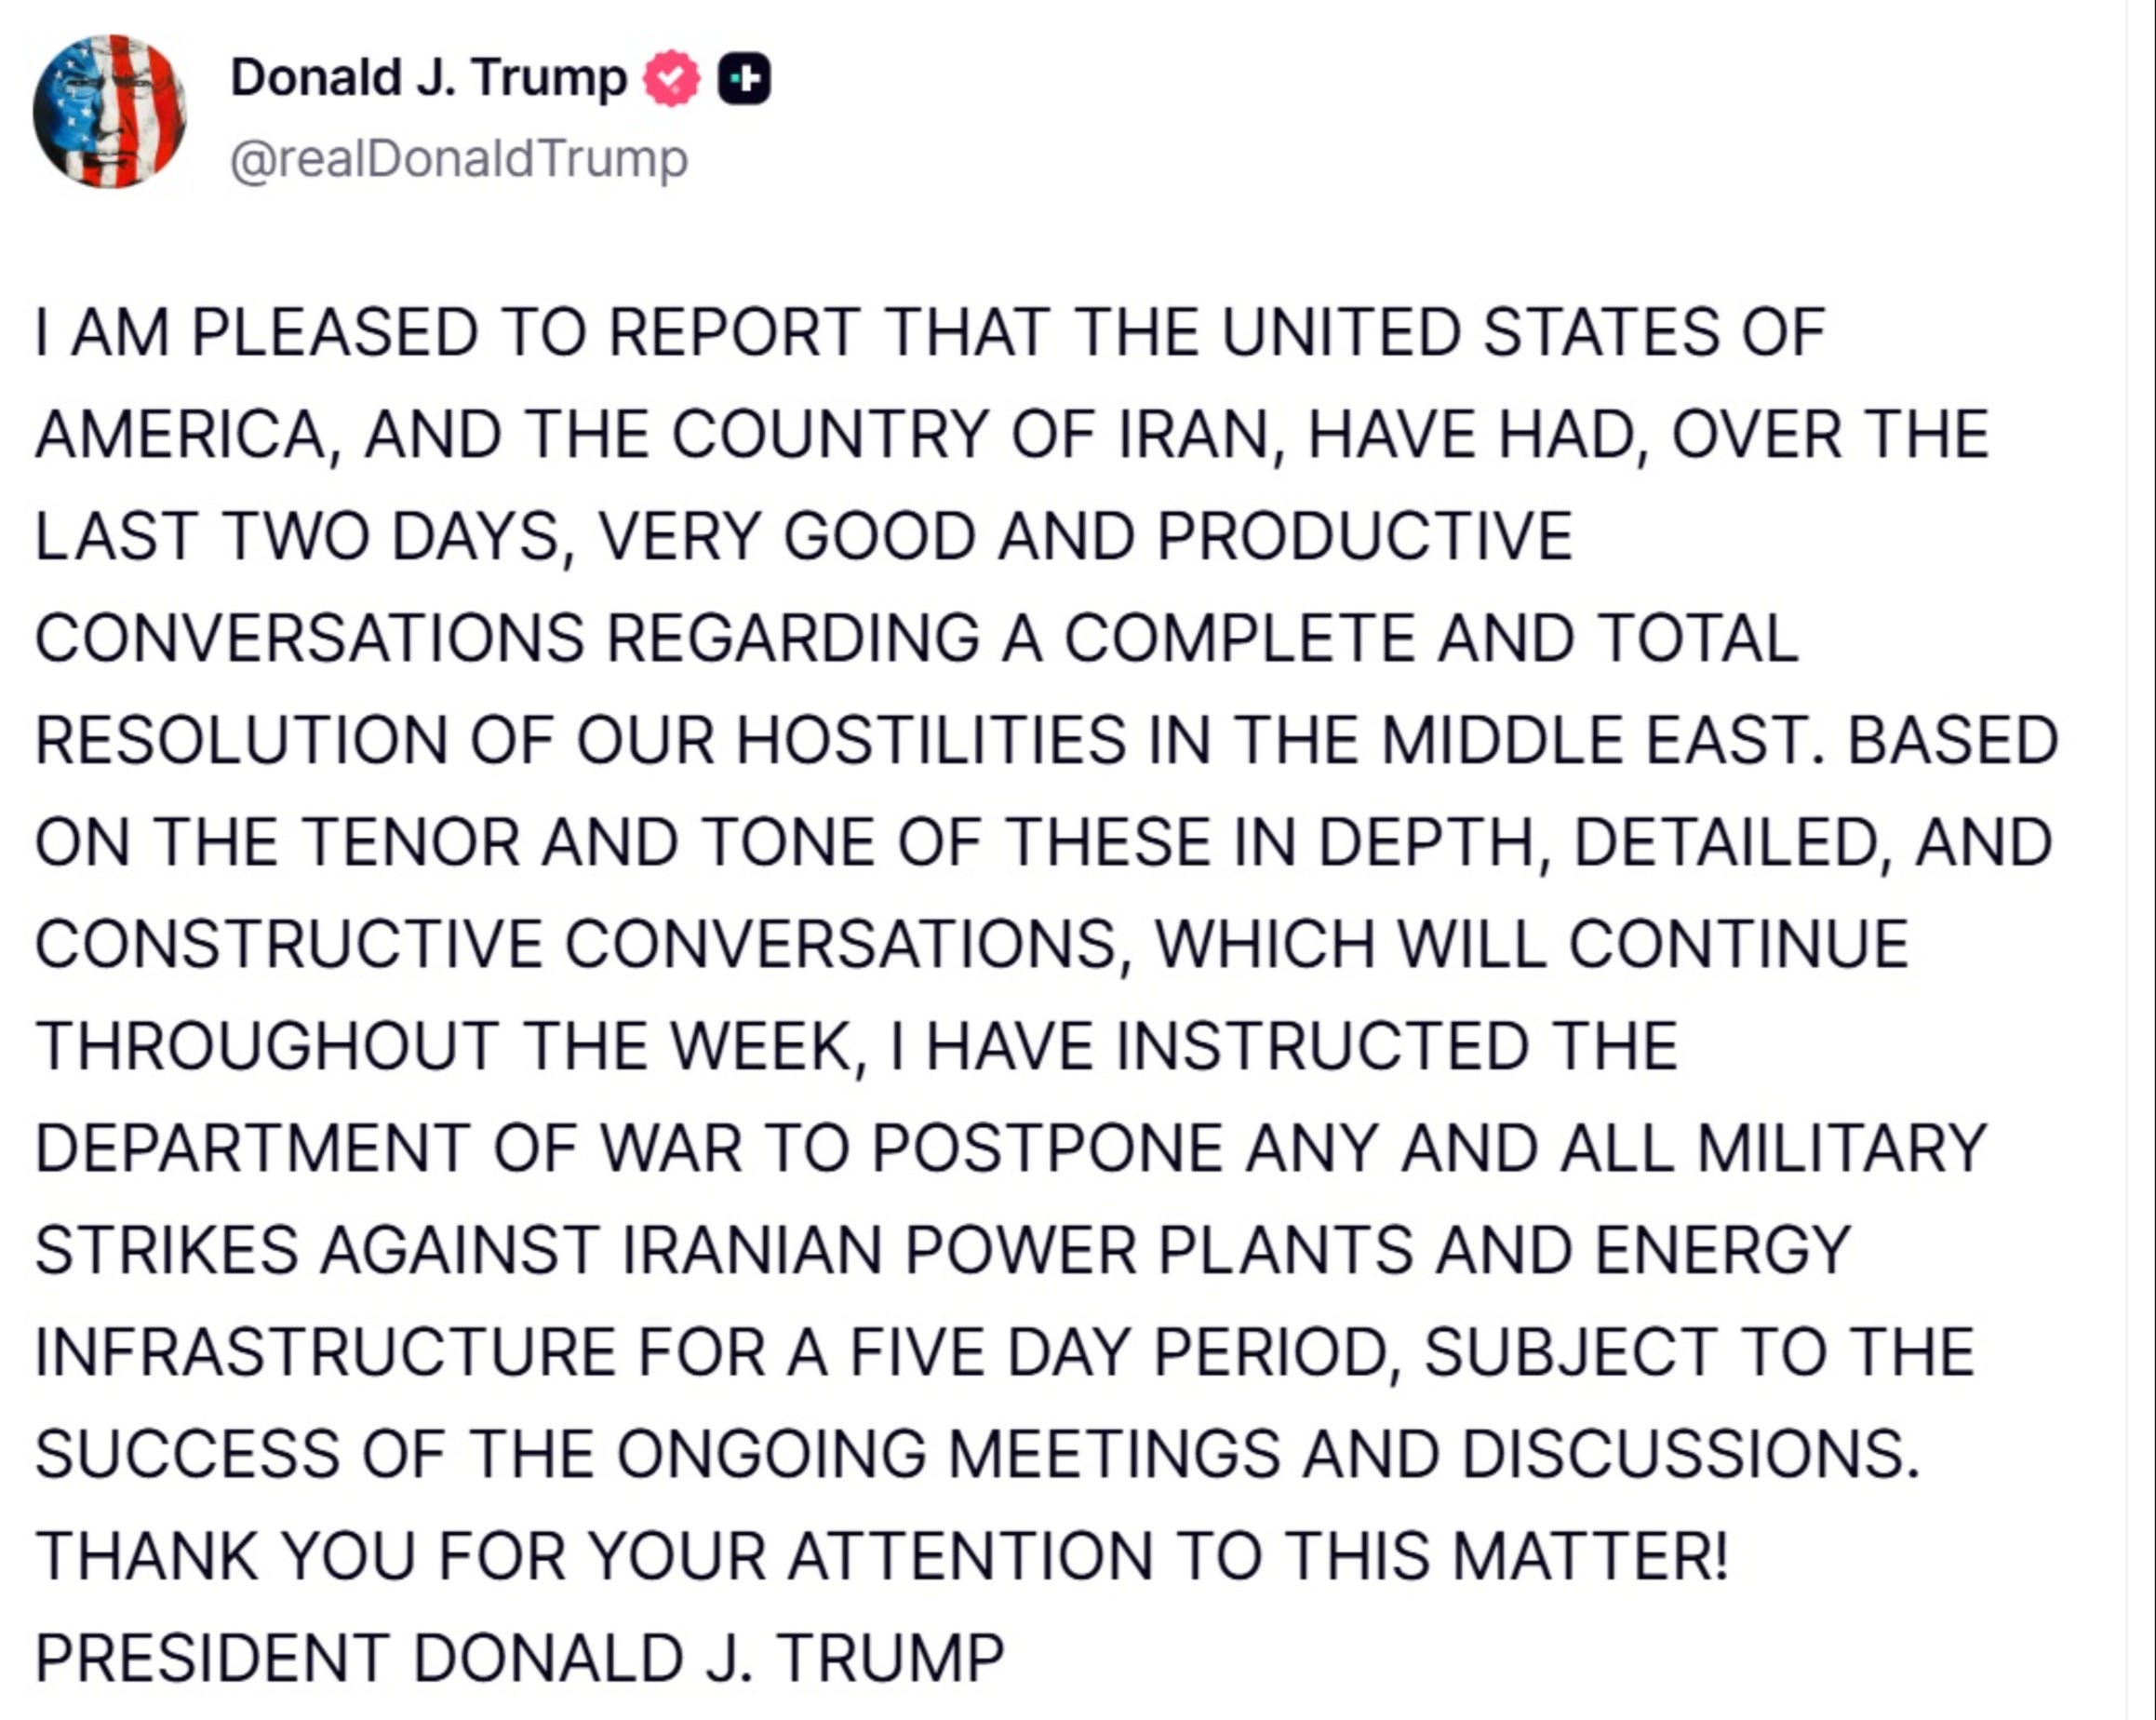
TACOs have become a running joke ever since Trump first reversed course on his tariff agenda in April last year - so traders won’t have been surprised to see Trump take a softer tone in regards to the Iranian conflict just as bond yields and oil were starting to make serious moves.
But unlike in April, when markets responded with a sharp move higher as Trump TACO’d on tariffs, yesterday’s reaction was somewhat muted - with SPY failing to recapture the 200dma and the moving average ensemble sitting as overhead supply.
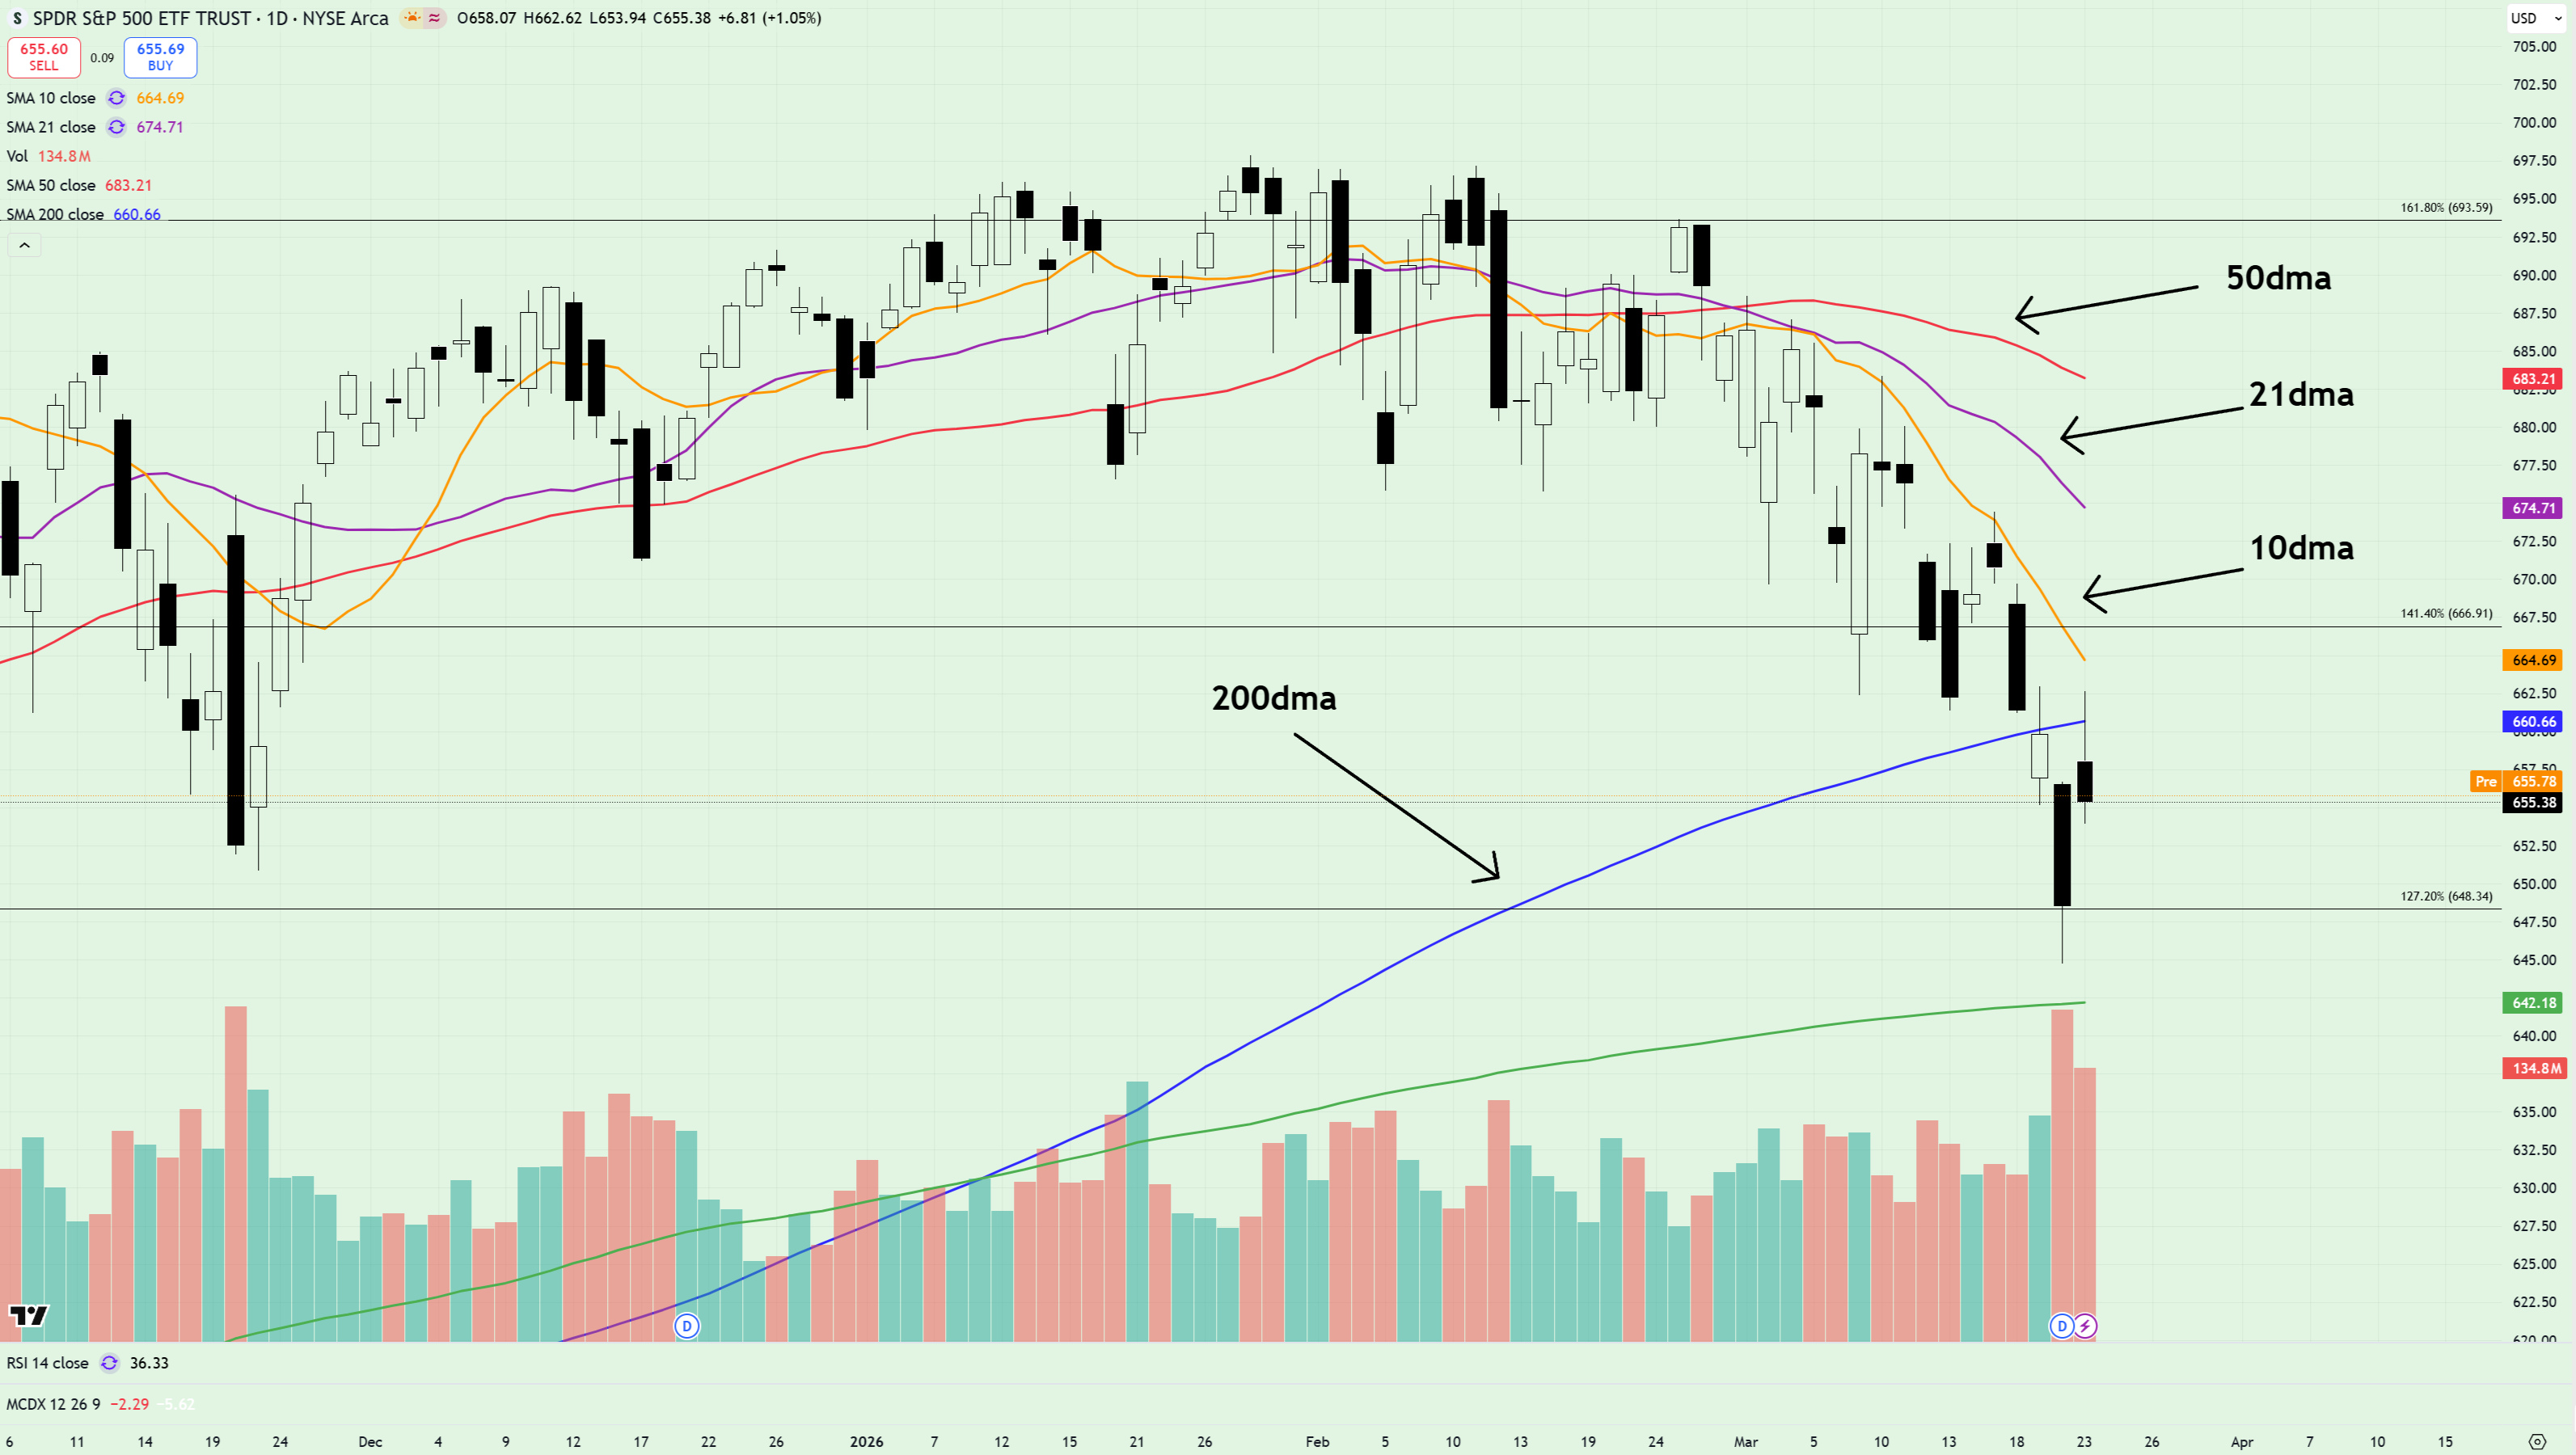
To summarize: until price breaks above the 200dma and the moving ensemble annotated above, the outlook remains decidedly bearish for a market spooked by the largest energy and supply shock since the 1970s.
Could this change on further talks of de-escalation? Of course - and staying open to all possibilities remains the only course of action during these unpredictable times.
But for now key battle lines are drawn where the moving averages reside.
Should price break higher, then we can talk about a recovery. But as long as they’re stuck below, lower prices remain the likelier outcome.
Trade idea: fade rips below key moving averages - IWM, QQQ, SPY
Intermarket Reconnaissance
No trader should go into a trade with blind faith that it’ll pay off. Like Captain John Miller in Saving Private Ryan, you need a clear sense of direction when the landscape turns hostile and visibility drops to near zero.
In uncertain environments like this, discipline matters more than conviction.
That’s why I keep a small group of charts acting as my “north star” - signals that help cut through the noise when yields are rising, commodities are firming, and the macro backdrop feels like it’s shifting in real time.
These are the indicators I’m watching most closely right now.
XLP/XLY
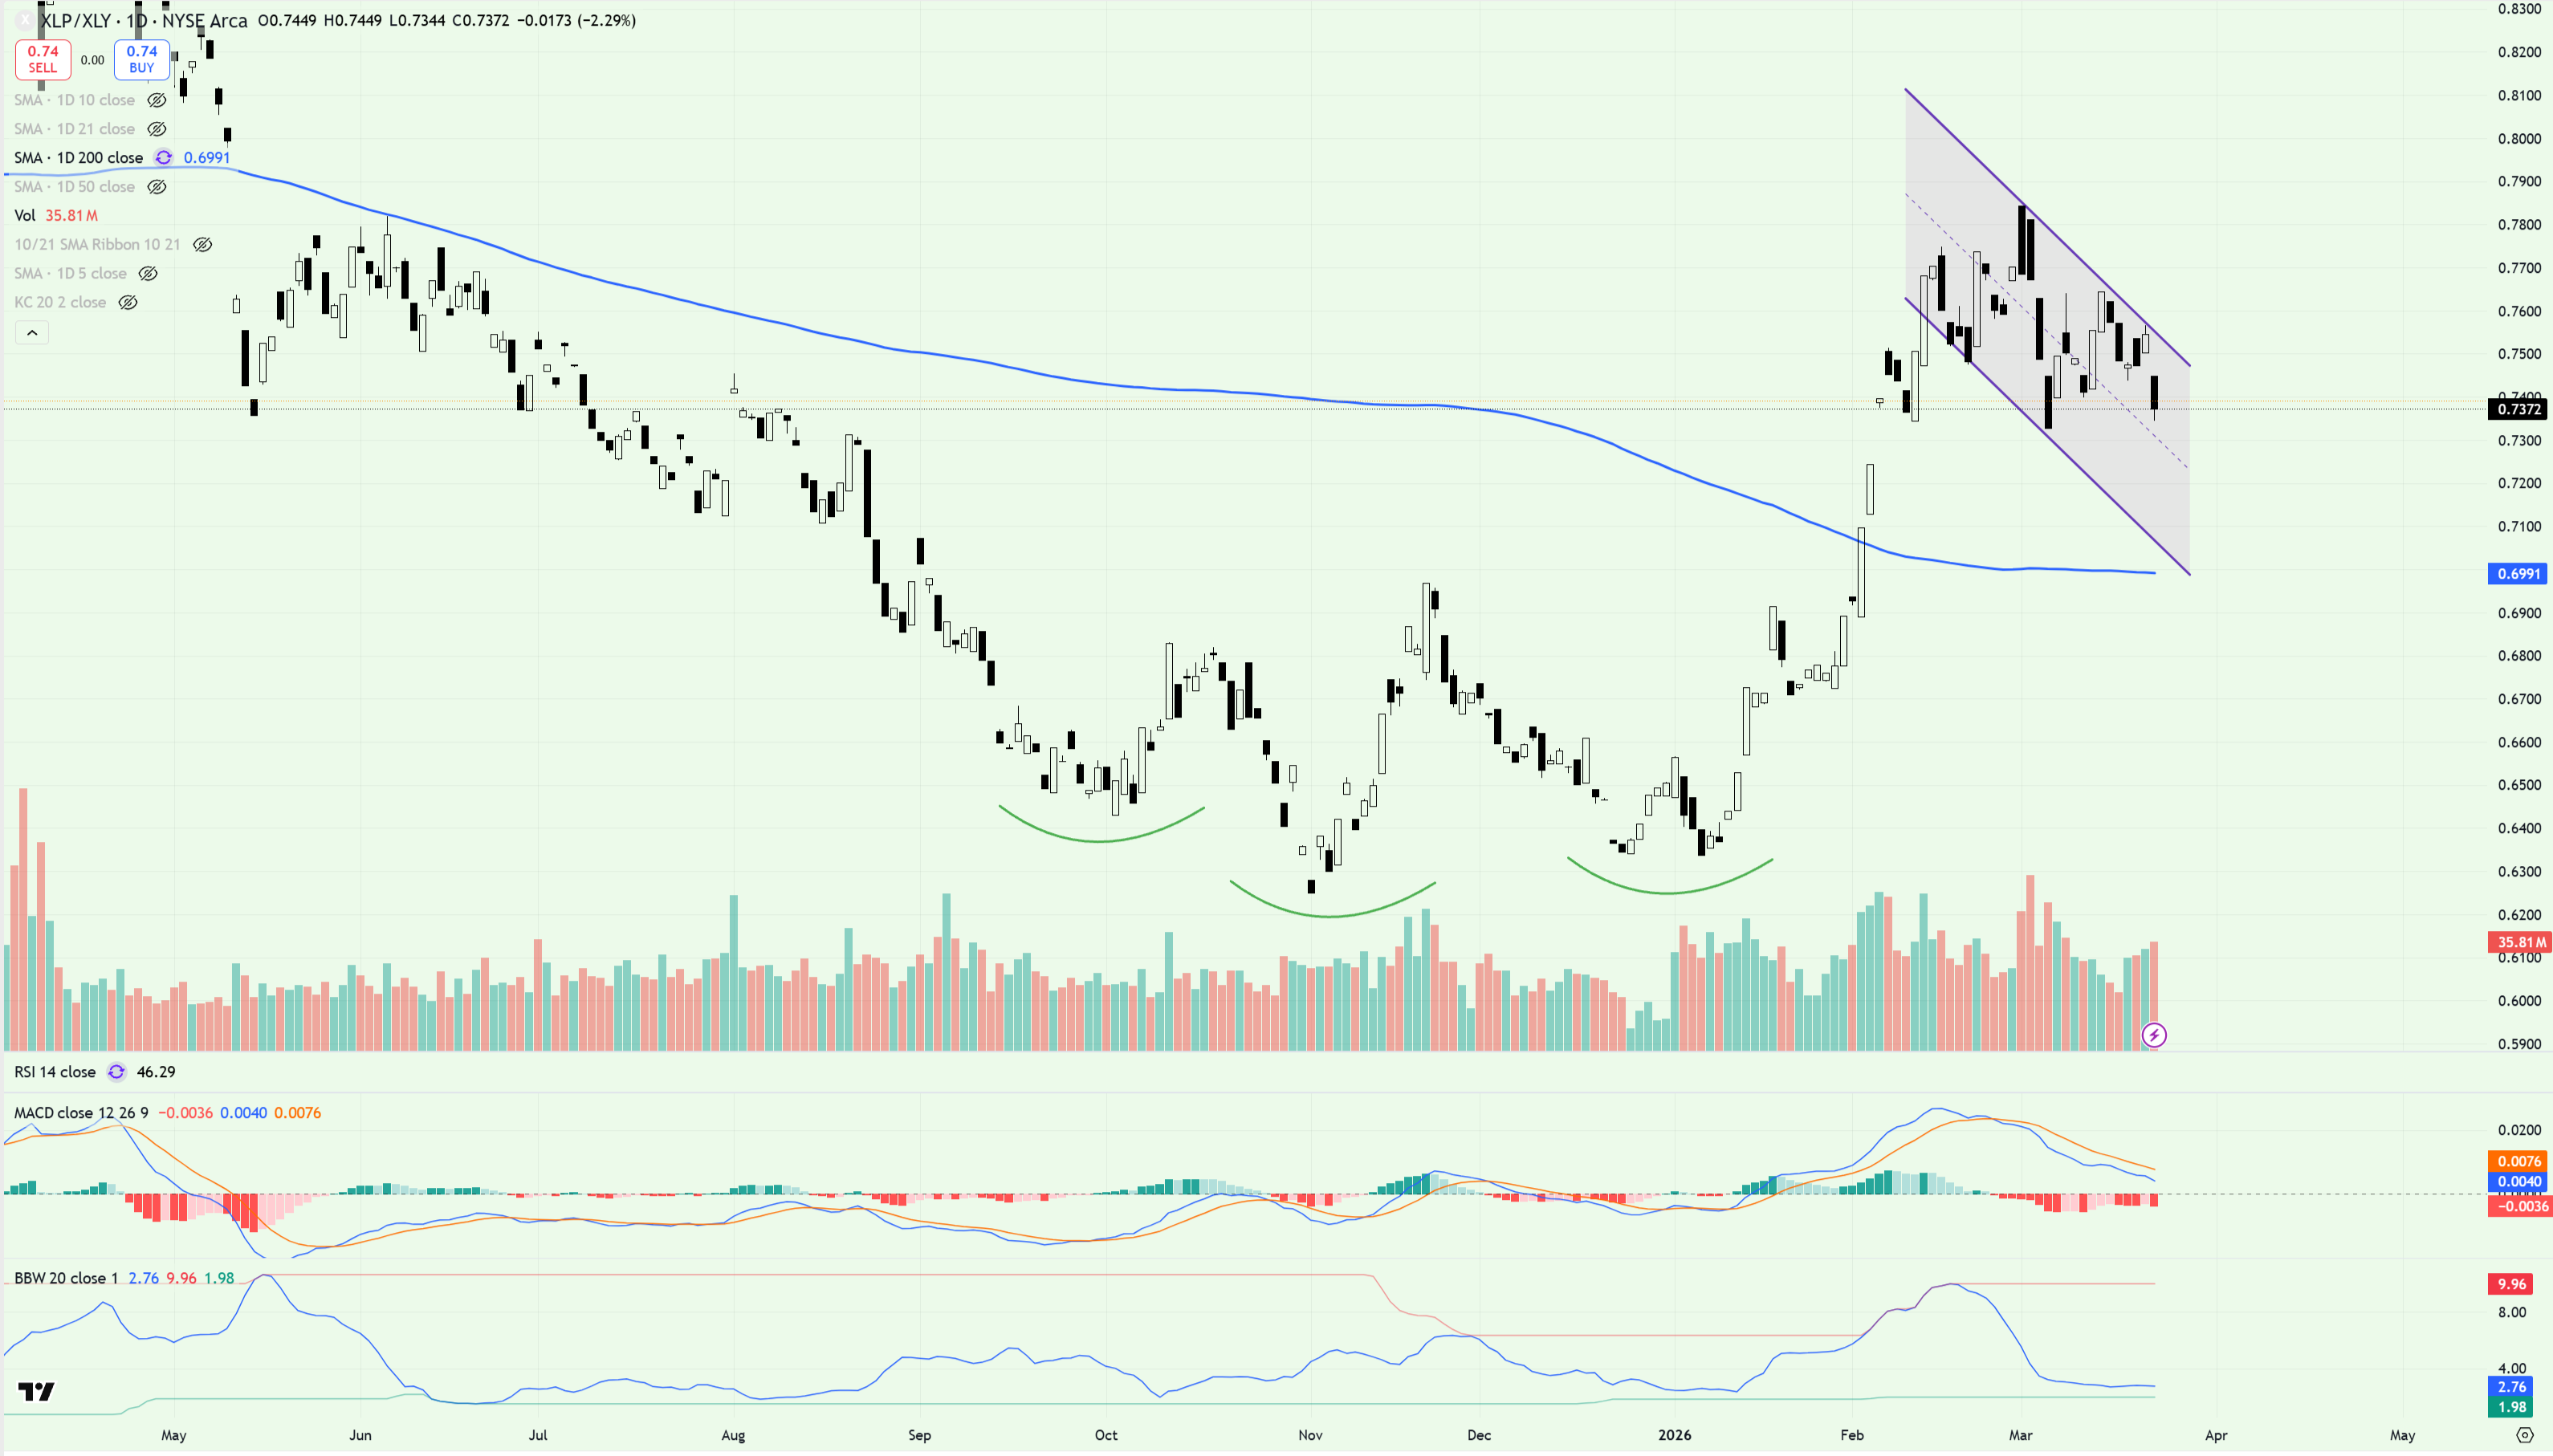
Combining the inverted H&S reversal base and the current flag pattern that’s been in play since mid February, it’s difficult to remain bullish risk assets so long as Staples (XLP) continue to outperform Discretionary (XLY) stocks.
TLT/SPY
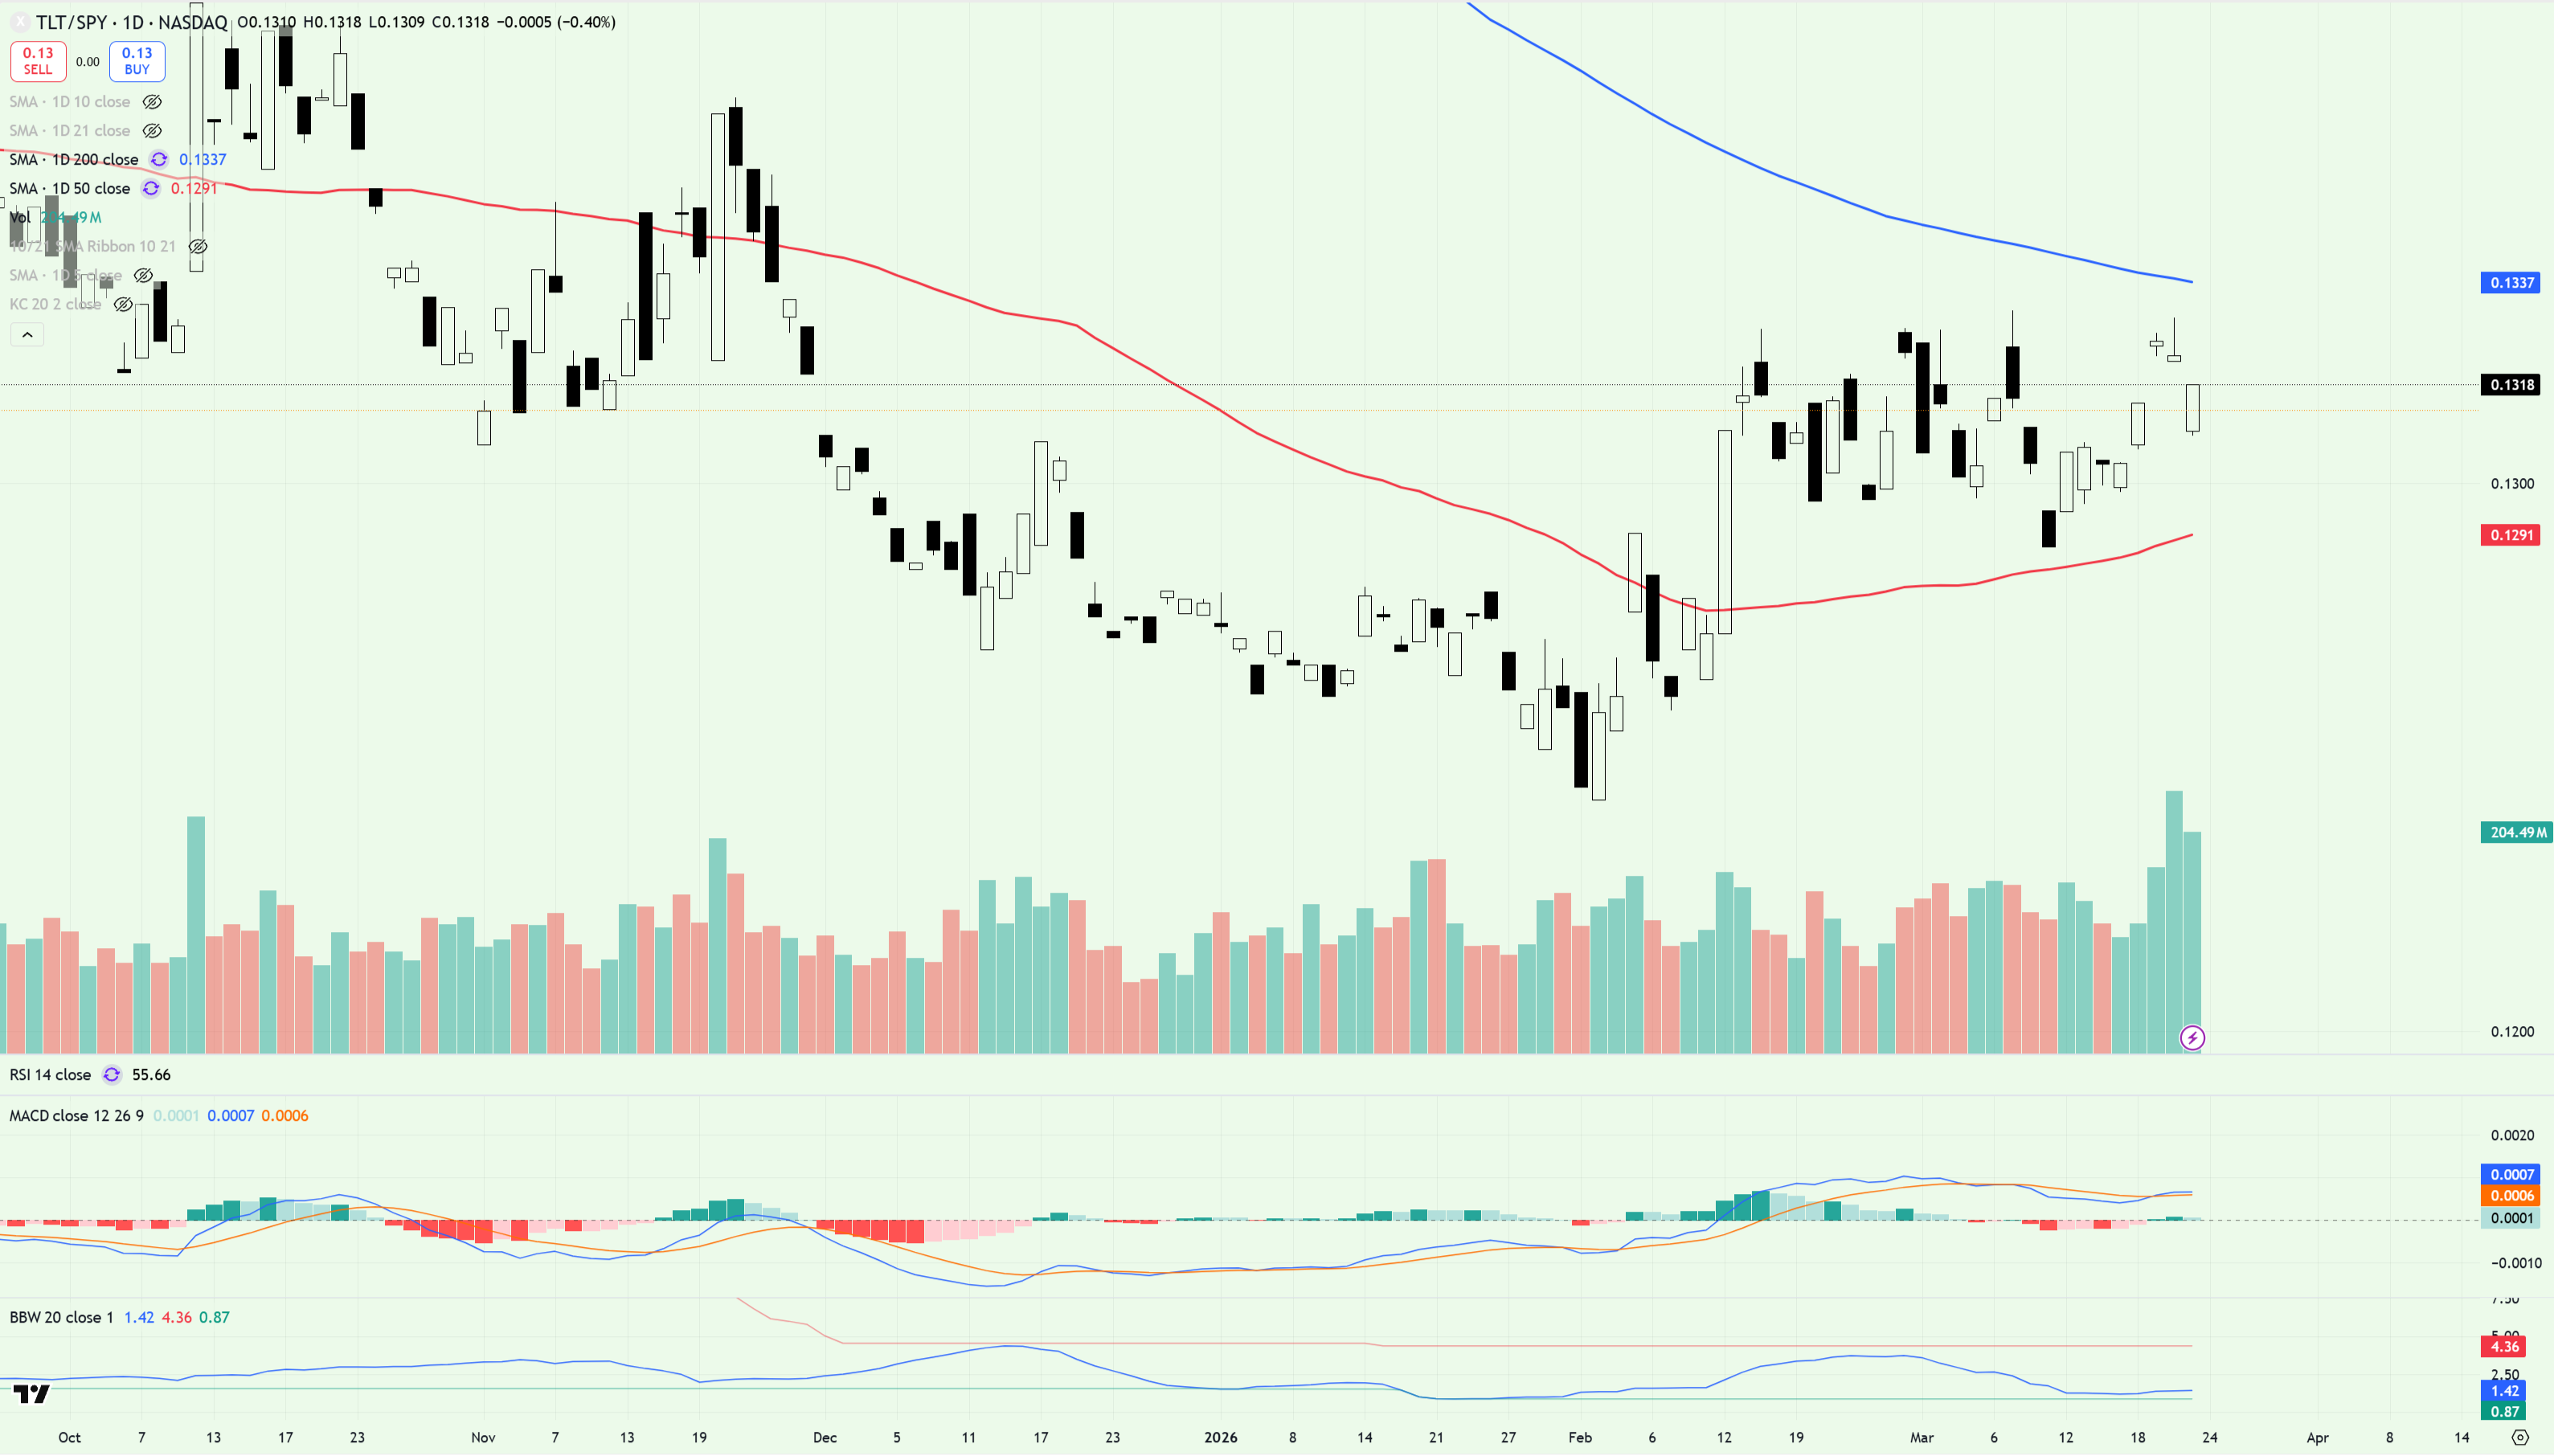
TLT relative to SPY continues to flag above an upwardly mobile 50dma. So long as it stays here, markets remain in ‘risk off’ mode. Should we see a break below the 50dma, risk models (which you can read about here) return to the clean air zone, signaling a positive step in the right direction for bulls.
XLF/SPY
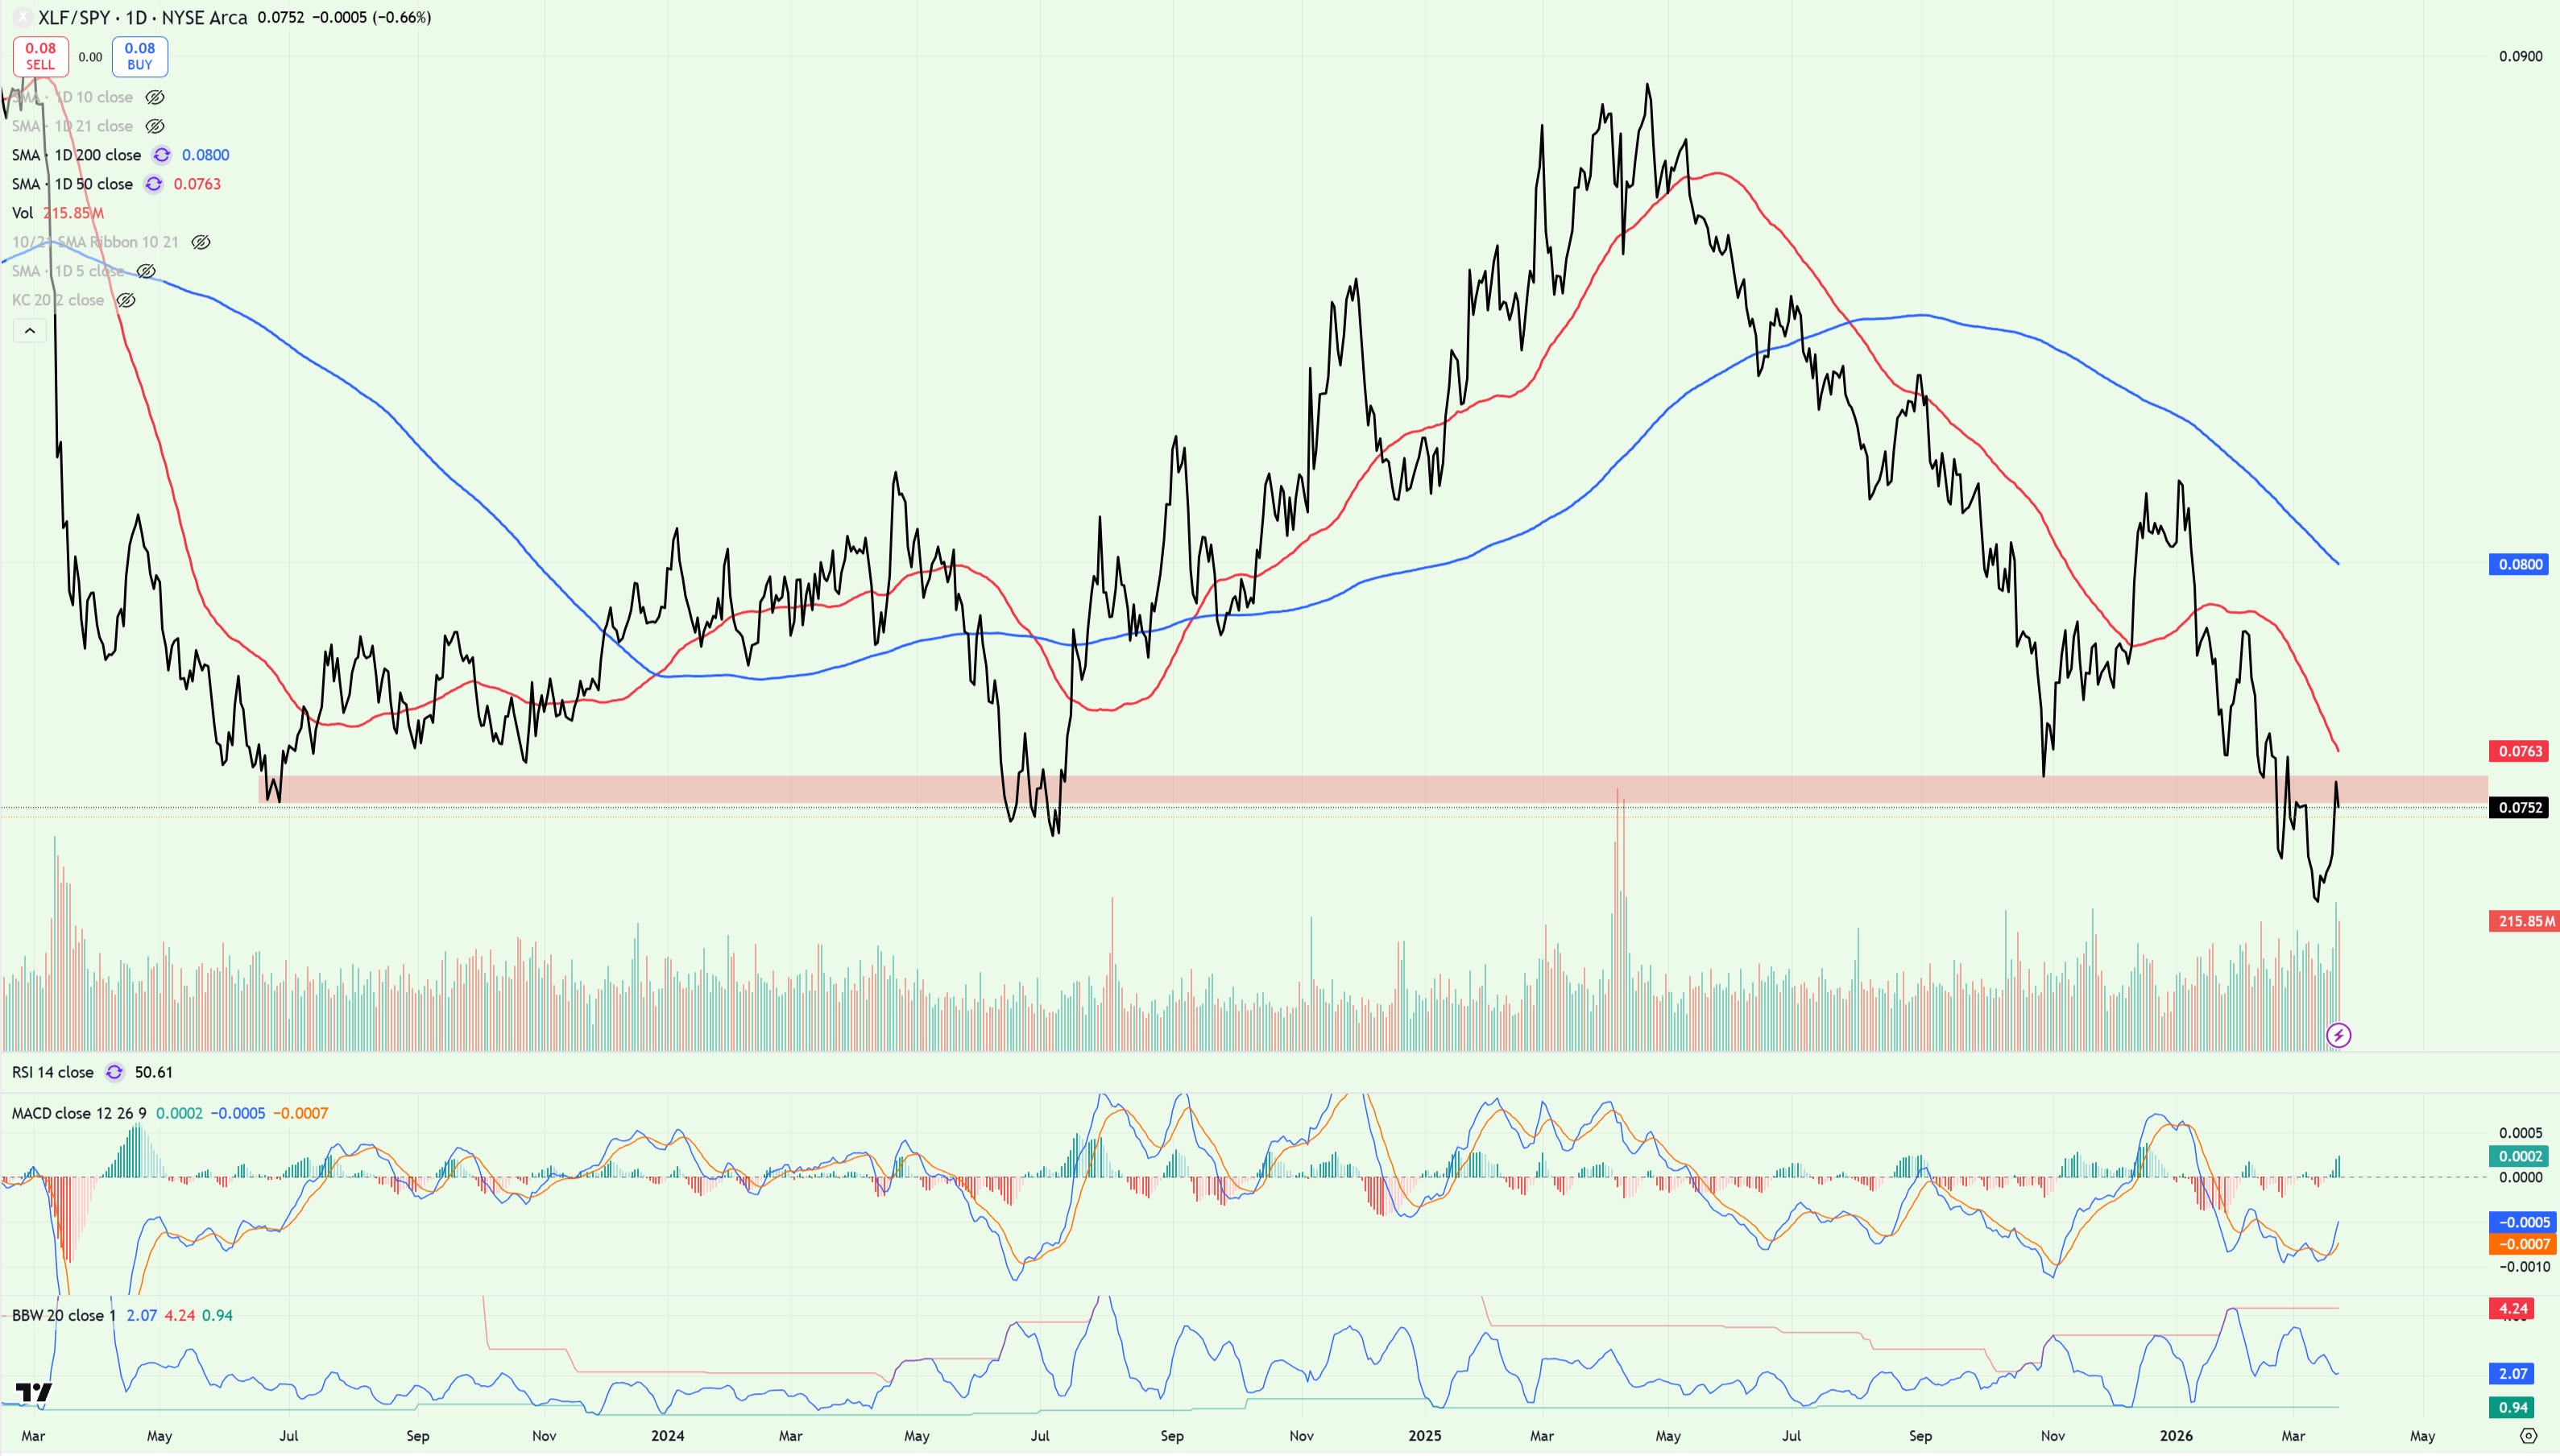
Note the red bar - that’s prior support for Financials (XLF) relative to the S&P 500 (SPY) currently working as resistance. Below this level, markets remain firmly in ‘risk off’ mode, further evidenced below a declining 50dma and 200dma.
MOVE
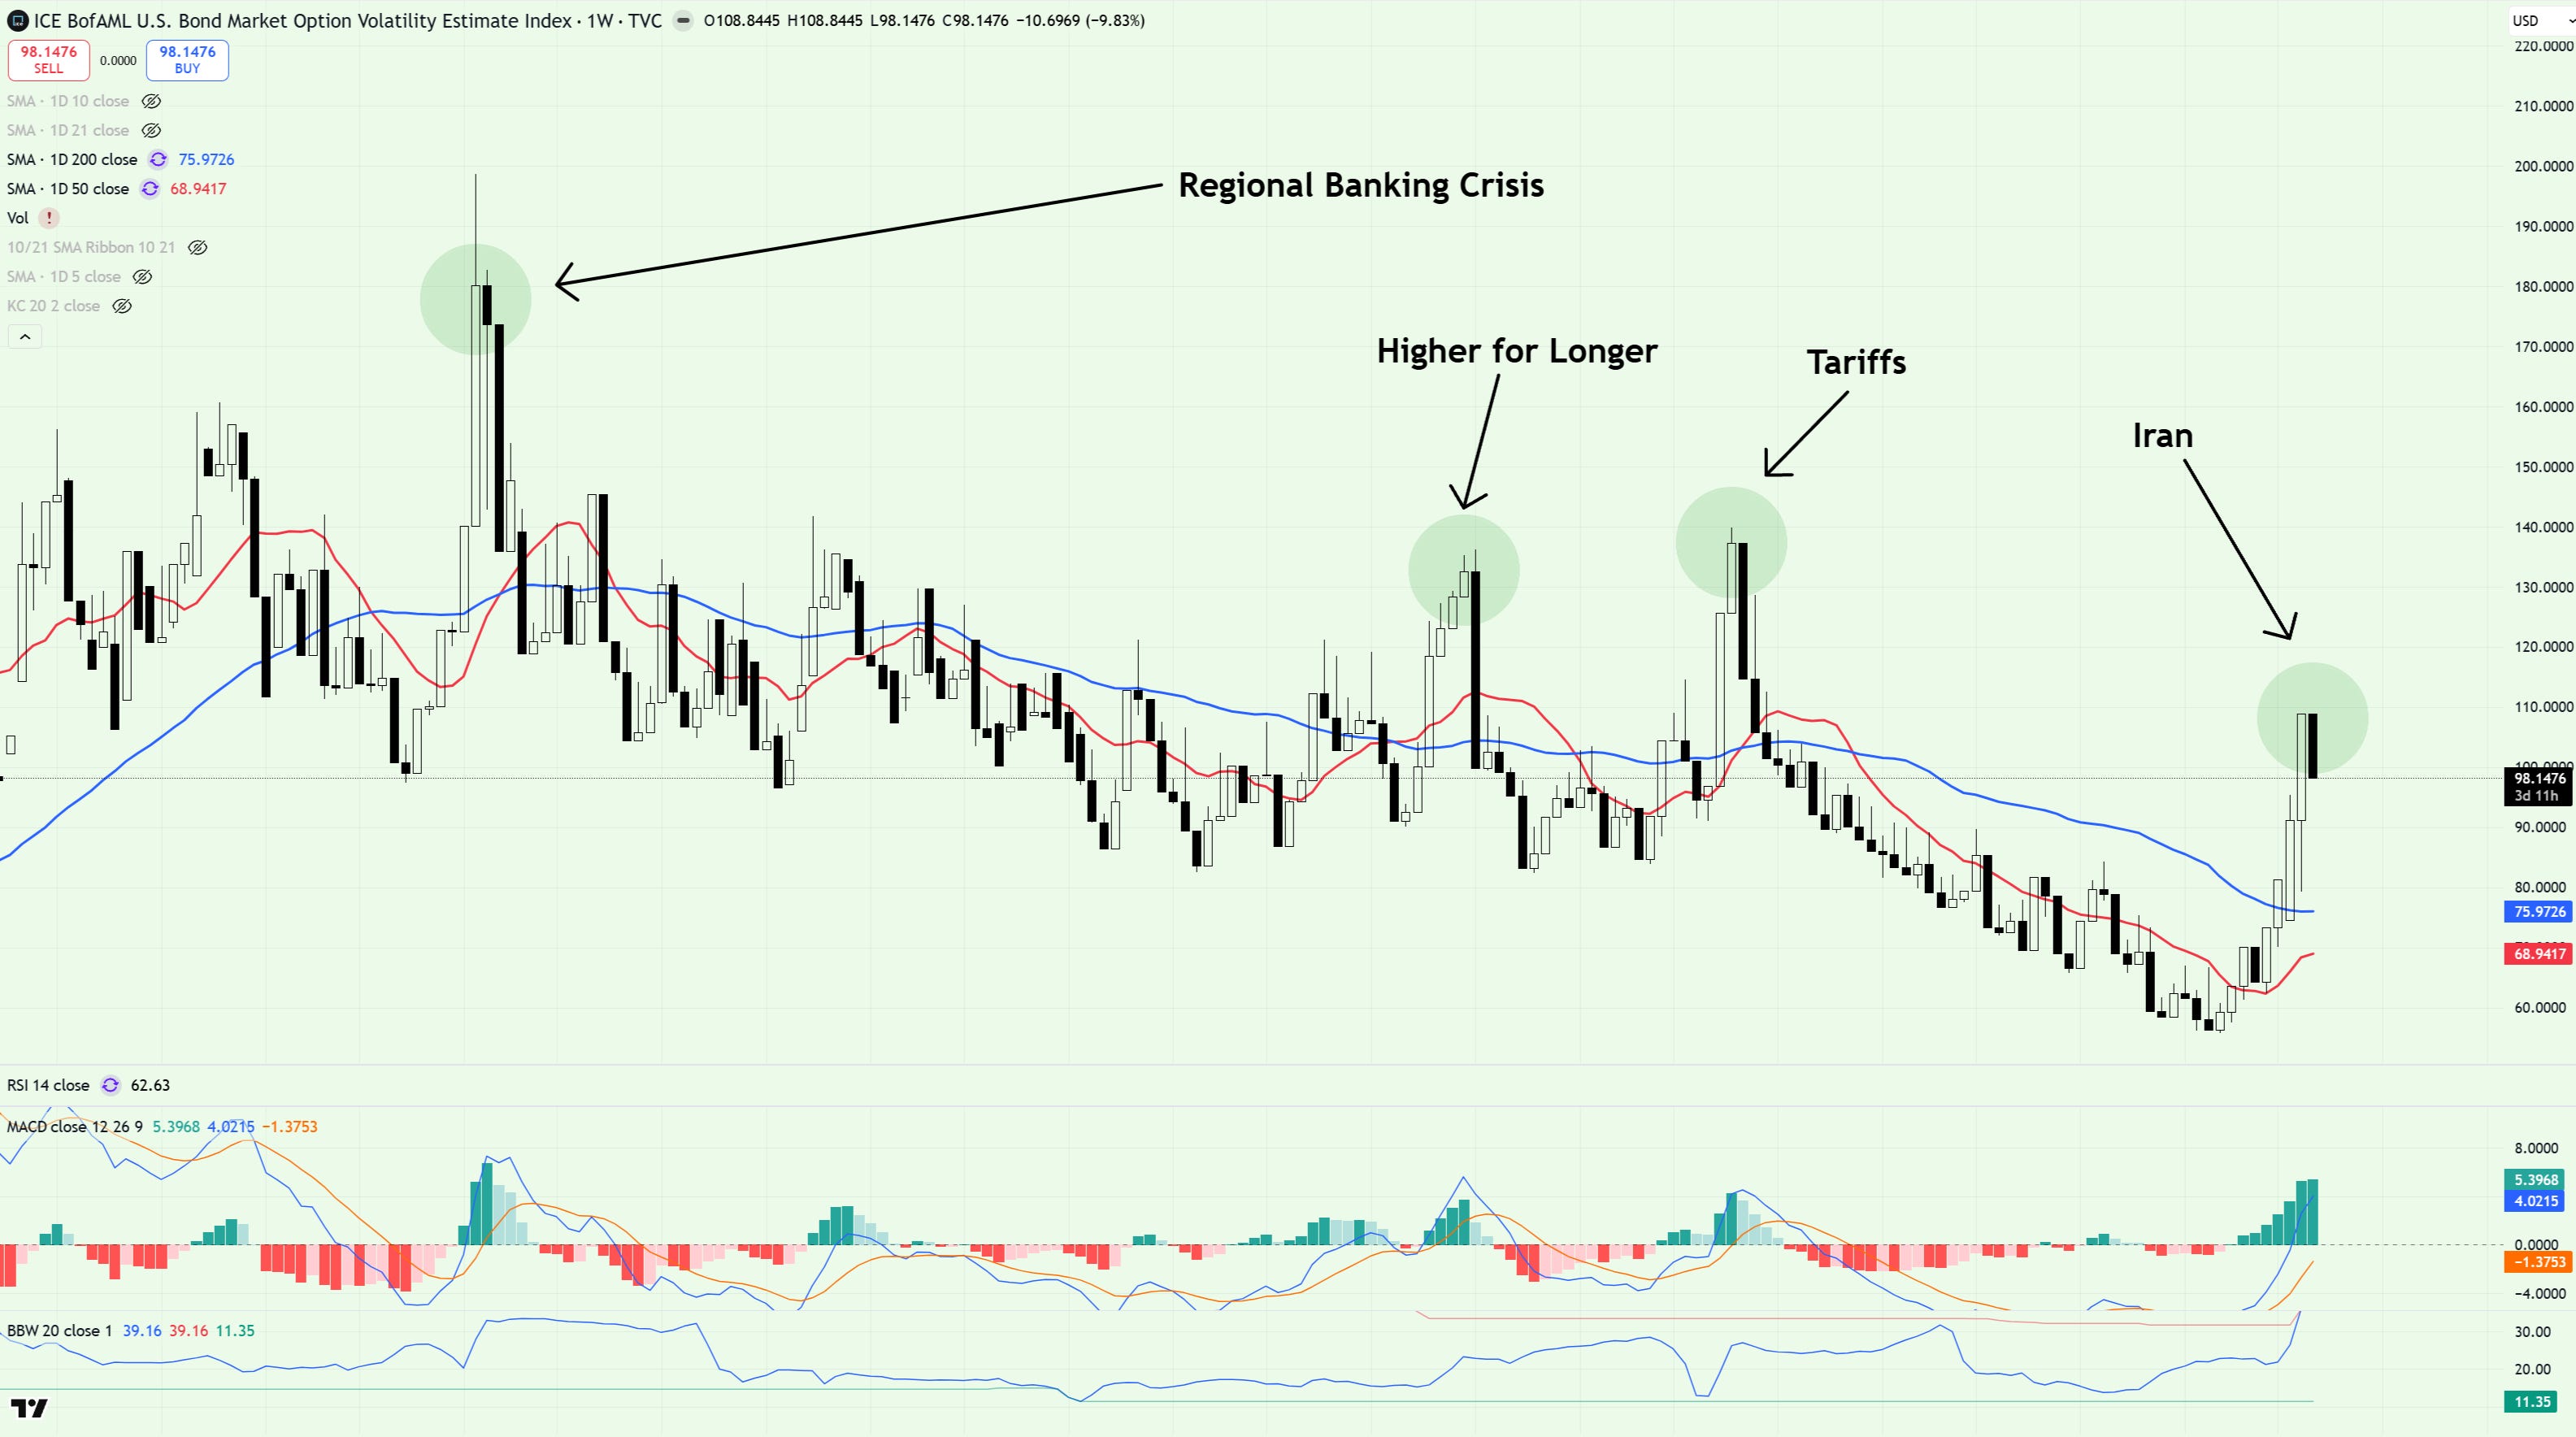
When the MOVE index - essentially the bond market’s version of the VIX - spikes above the 200dma, equities enter correction/bear market territory. Bulls need to see the present spike fade quickly, much like the prior notable instances annotated on this chart. Bears hold the ball until that plays out.
Credit Spreads
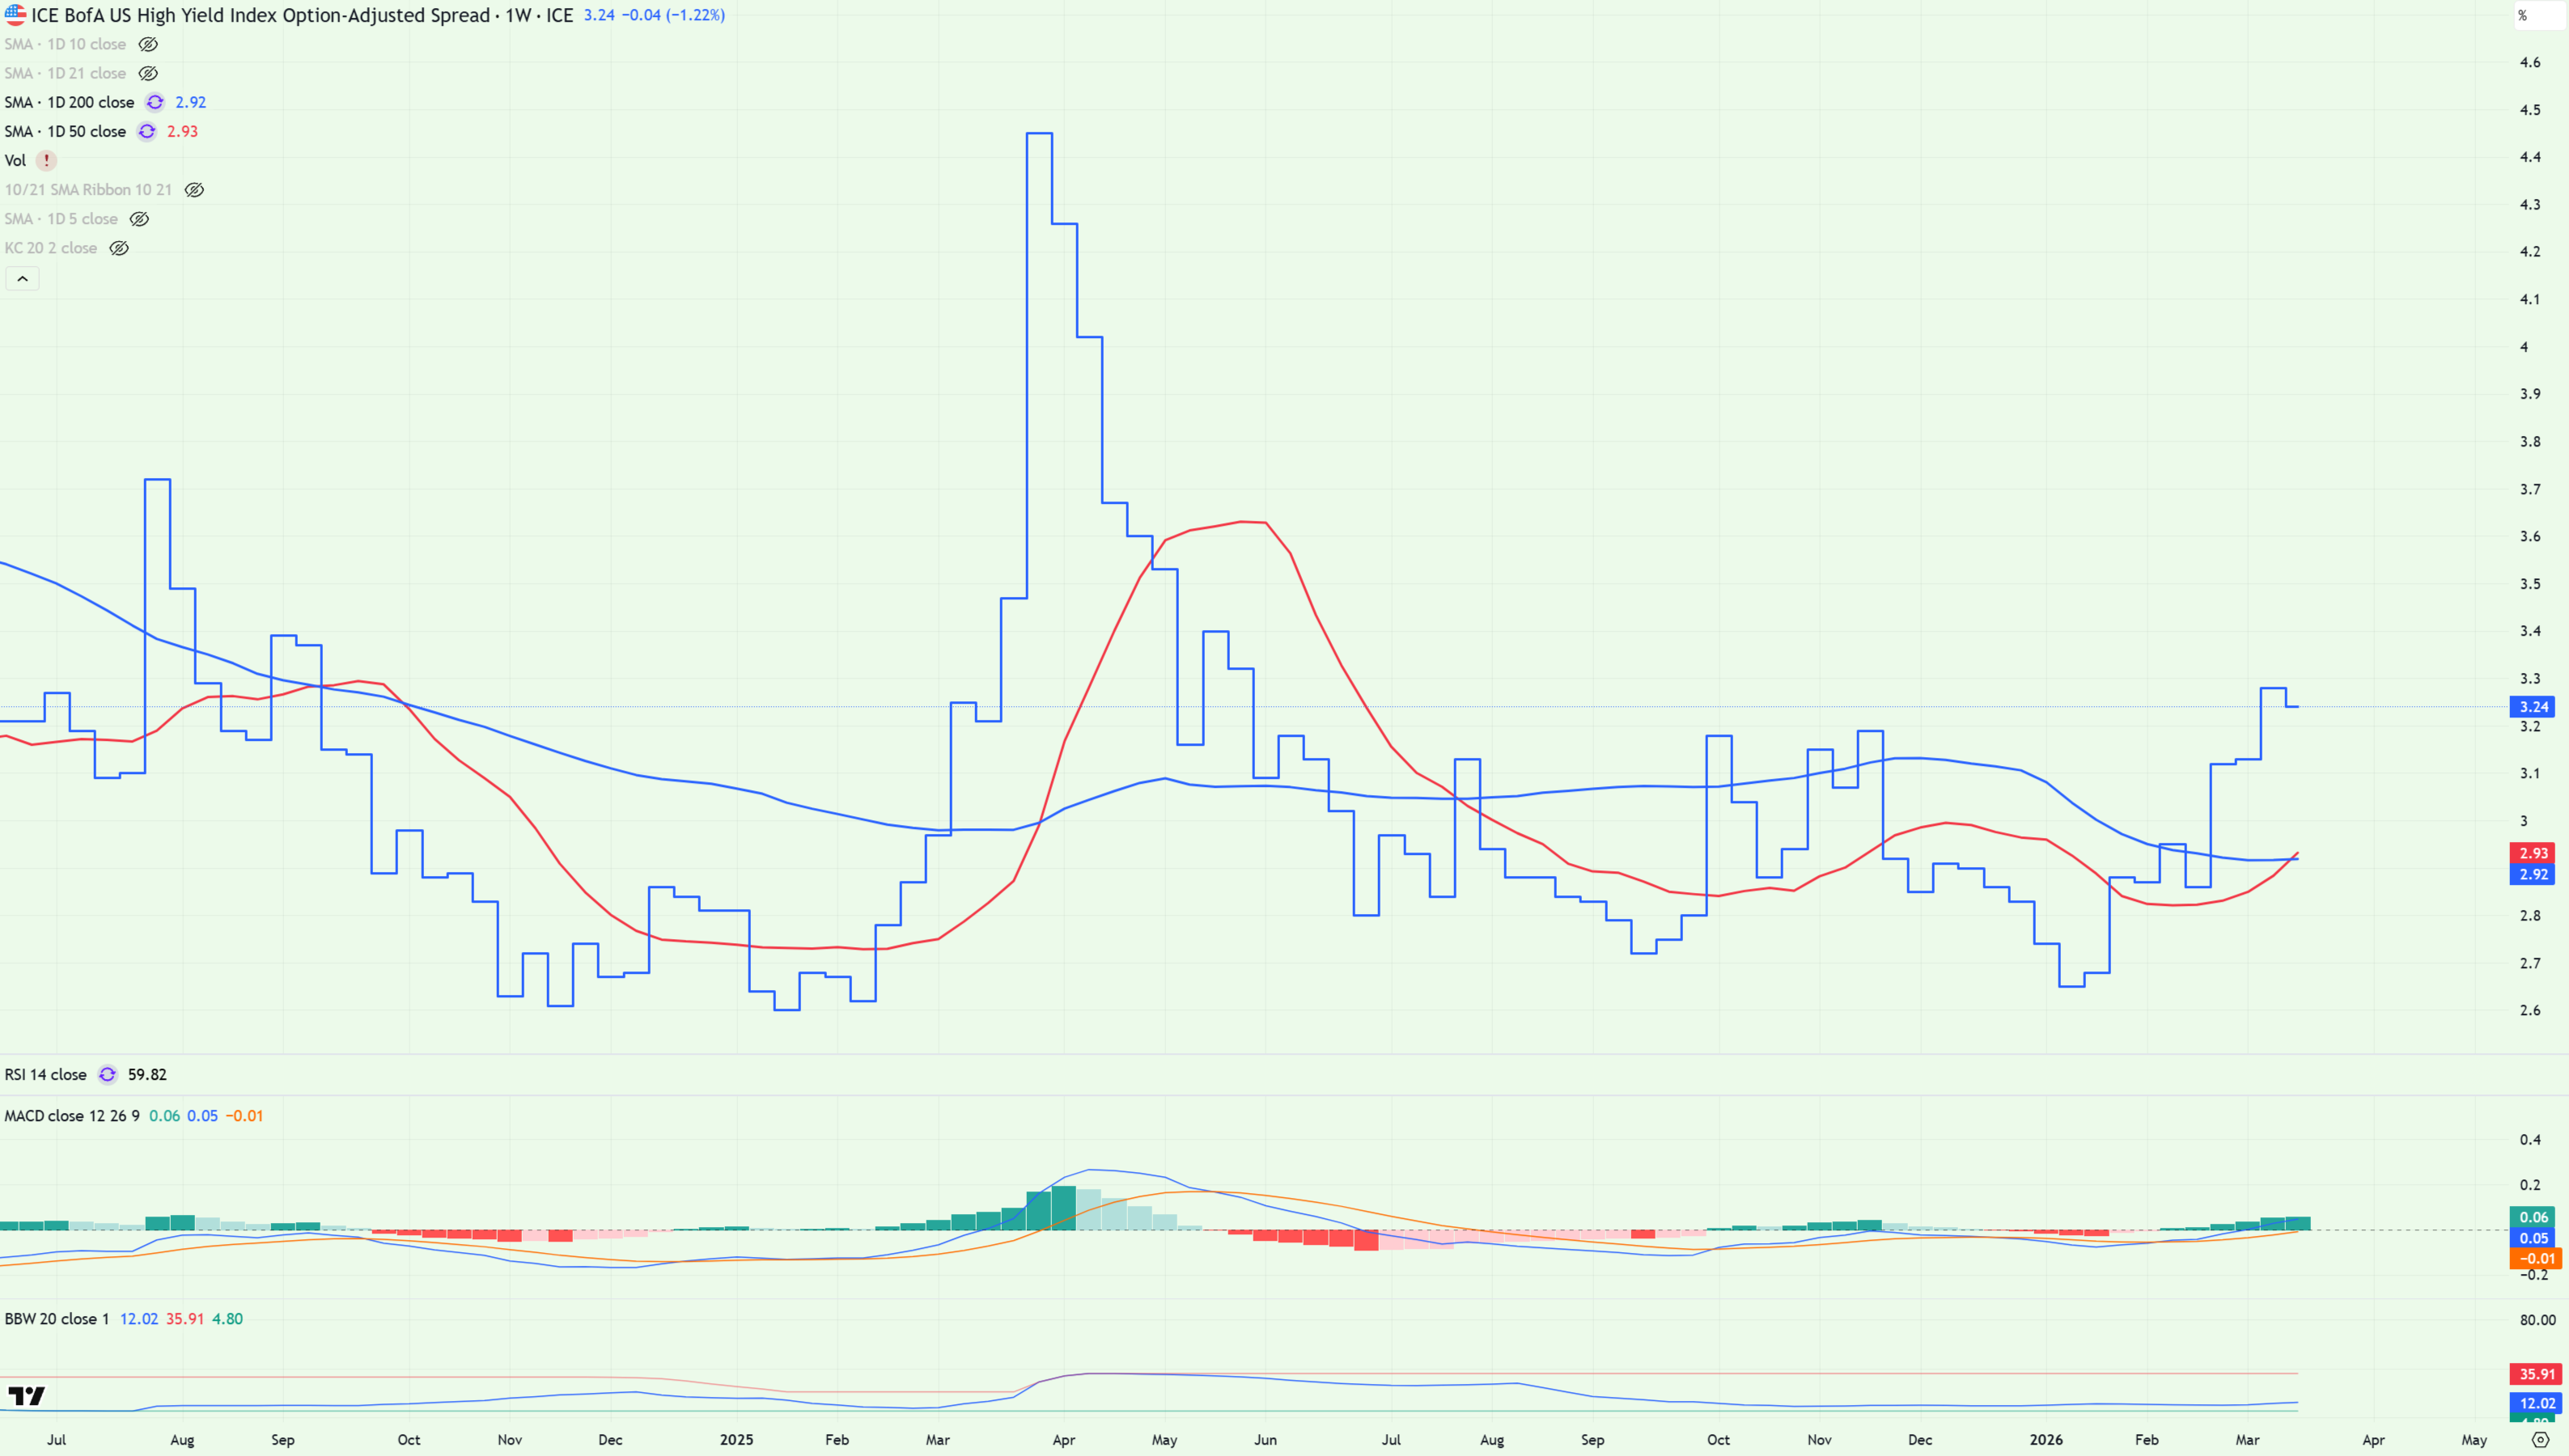
Despite sitting at historically low levels, spreads have been in an uptrend throughout 2026 - adding pressure to risk assets across the board. A golden cross looks to be forming on the daily chart, again signaling growing stress under the hood.
Cash in the Bank
It may sound boring, but in times like this - when headlines break faster than decisions can be made - the advantage belongs to the trader who pauses like Captain Miller, checks the map, and moves with purpose while everyone else is running on instinct.
This was something I was keen to highlight on X over the weekend - a timely post given the events that transpired during yesterday’s session:
For now, I’m holding one long term swing - short TLT - and fading intraday rips on SPY. That’s just my style at the moment.
Another strategy is to sniff out relative strength (Bitcoin has held up OK given the events of the last fortnight) and wait for the ‘north star’ charts to confirm it’s time to move. Because this isn’t the kind of tape that rewards hero trades - it rewards traders who wait for confirmation.
Have a great week.
Best,
Alex