

Sell In May, Or Stay And Play?
One Chart To Rule Them All....

In The Lord of the Rings, power flowed through one object: the ring. Whoever held it shaped the fate of Middle-earth.
Markets aren’t quite that dramatic. But there is one chart I keep coming back to when I want to understand what kind of tape we’re dealing with: SPY relative to GLD.
When it trends higher, advances tend to be impulsive - especially above key moving averages. But when it doesn’t, and price rejects off those same levels, what appears to be impulsive can soon turn out to be sinister…
…the market discovering the Ring wasn’t in friendly hands after all.
One Chart To Rule Them All
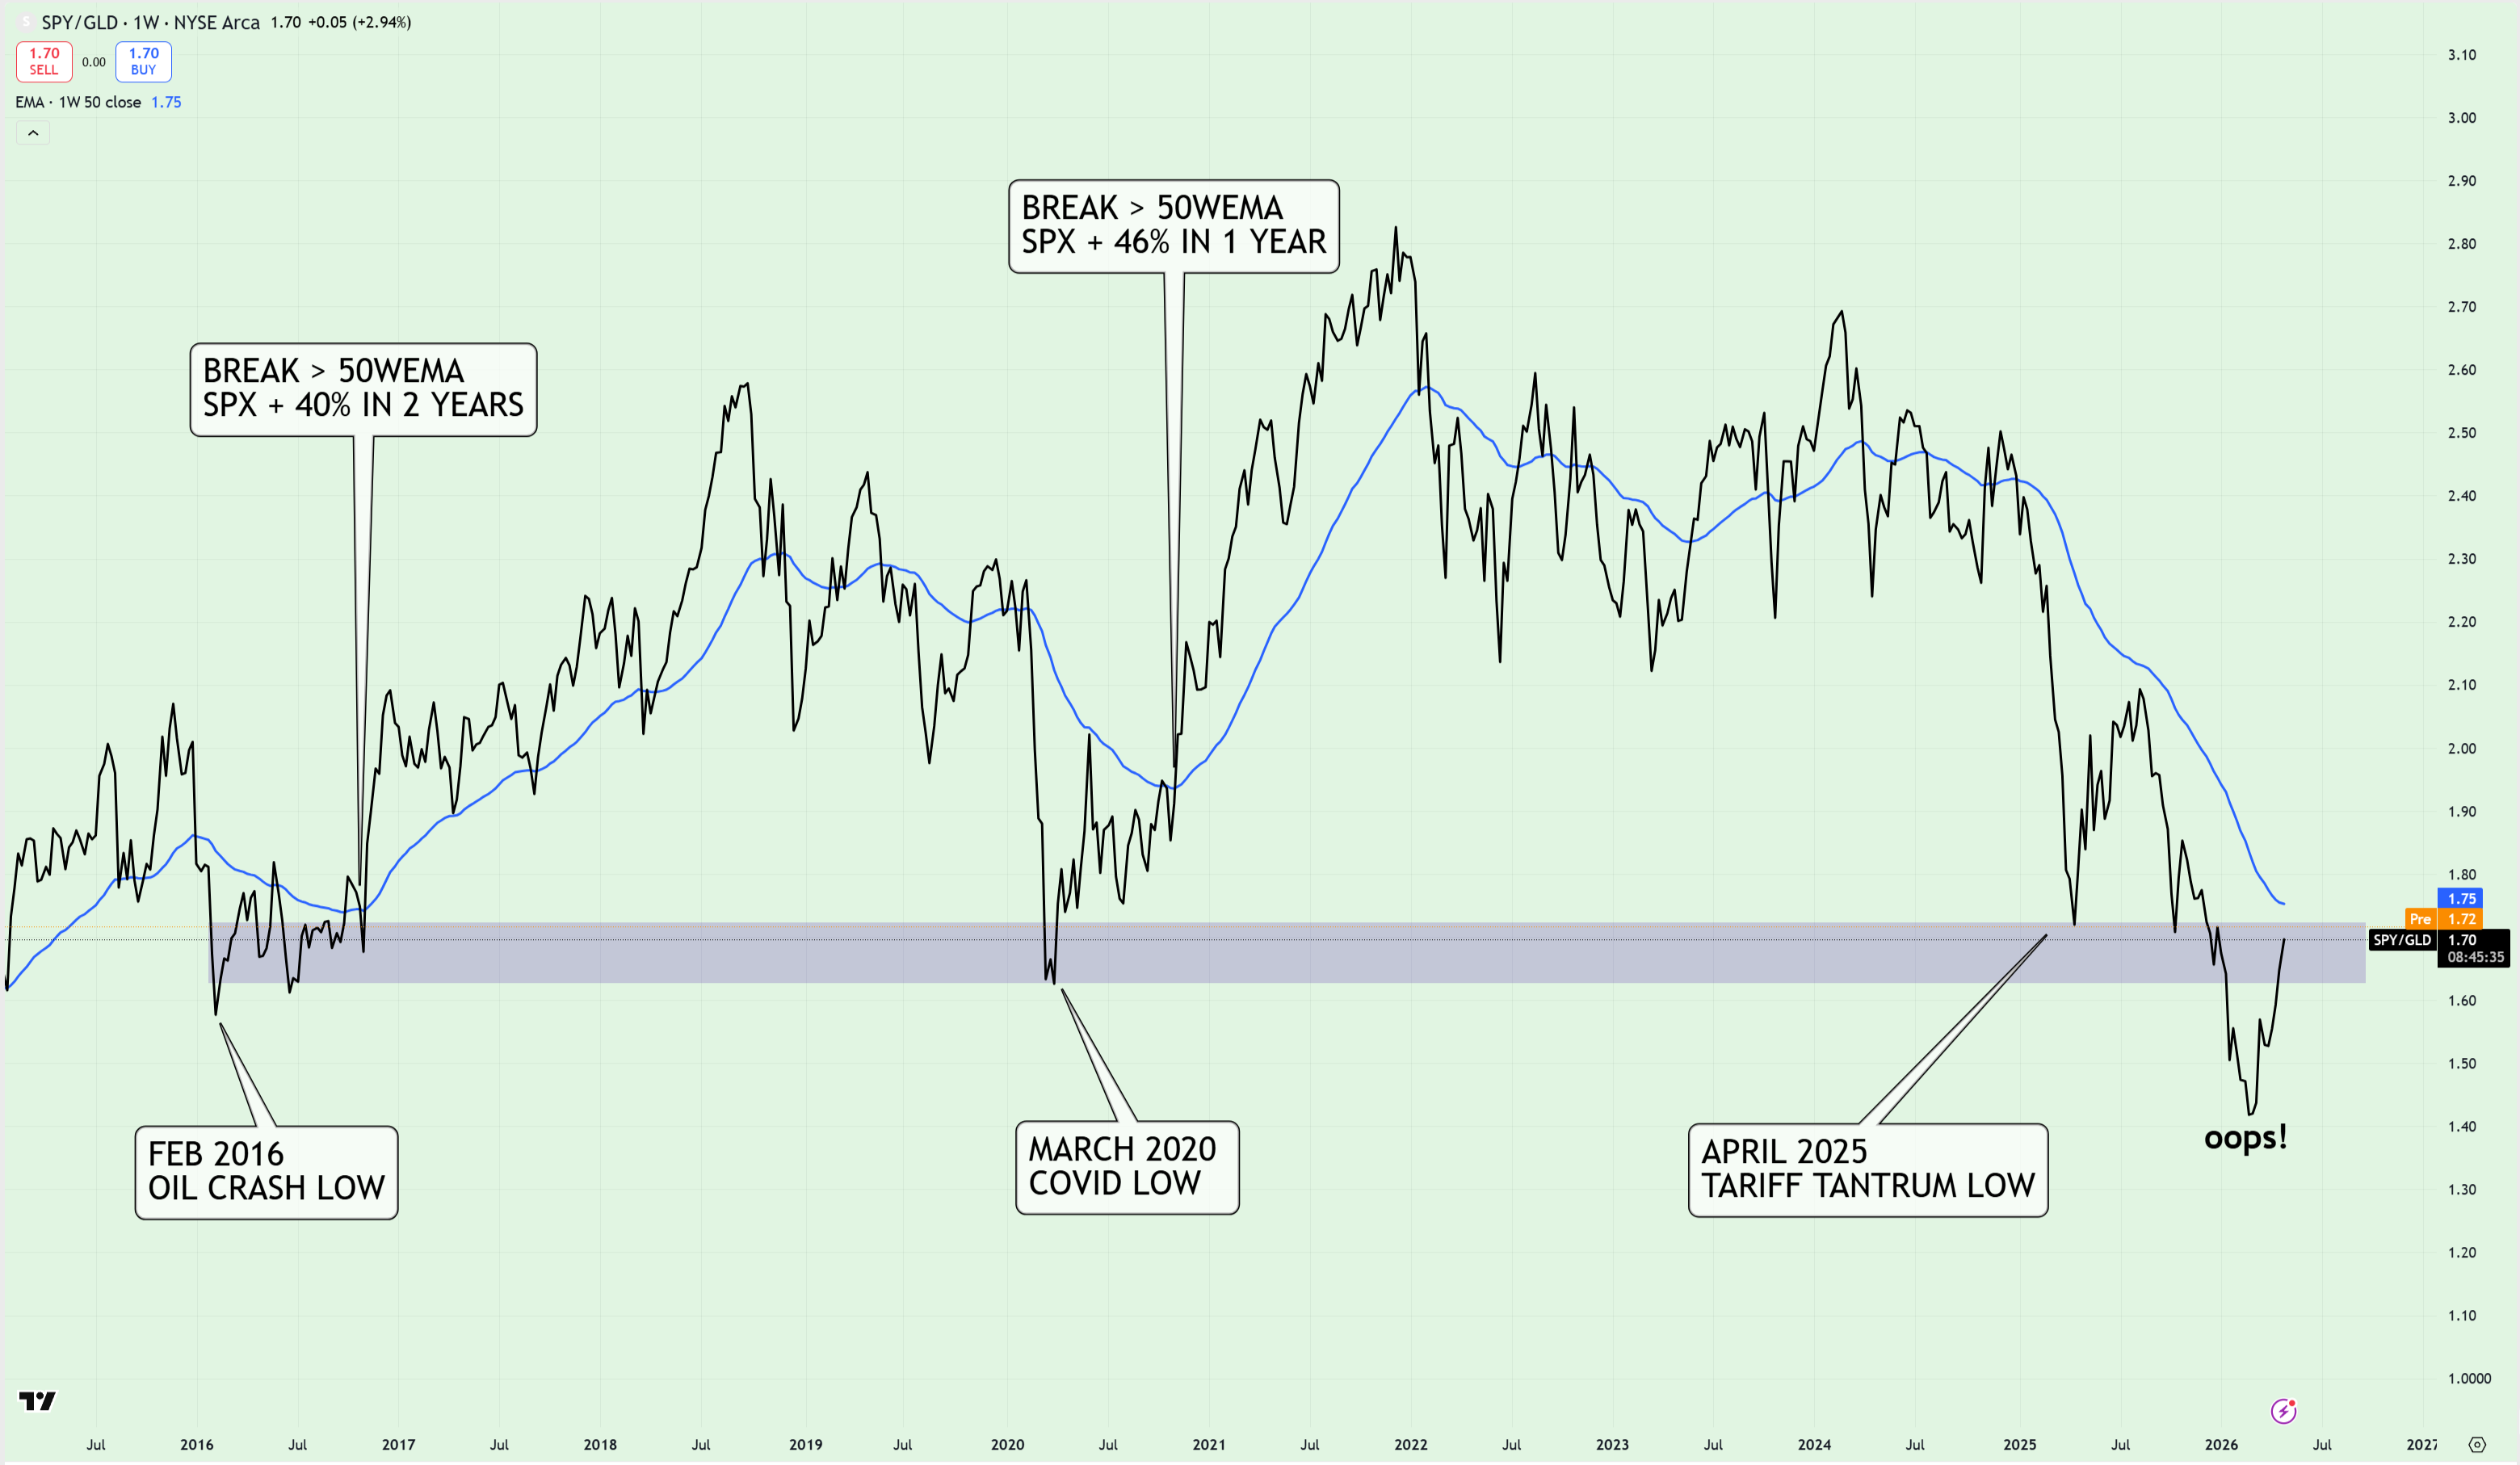
Here’s what we’re looking at - the black line is SPY relative to GLD on the weekly timeframe dating back to late 2015. The blue line is the 50WEMA and the purple bar is a key pivot which has consistently held as support dating back to 2016.
Let’s start with the purple bar.
V-shaped recoveries from this area have proven to be great buying opportunities (not one of these bottoms annotated on the chart have been revisited btw) but things get really fun when price breaks and holds above the 50WEMA.
What’s happening right now?
Price is staging a dramatic ‘oops’ reversal below the pivot, echoing the adage that from failed moves, come violent moves. In this case, a lock-out, face ripper of a rally that’s seen SPY gain over 14% in one month.
“It is a strange fate that we should suffer so much fear and doubt over so small a thing”
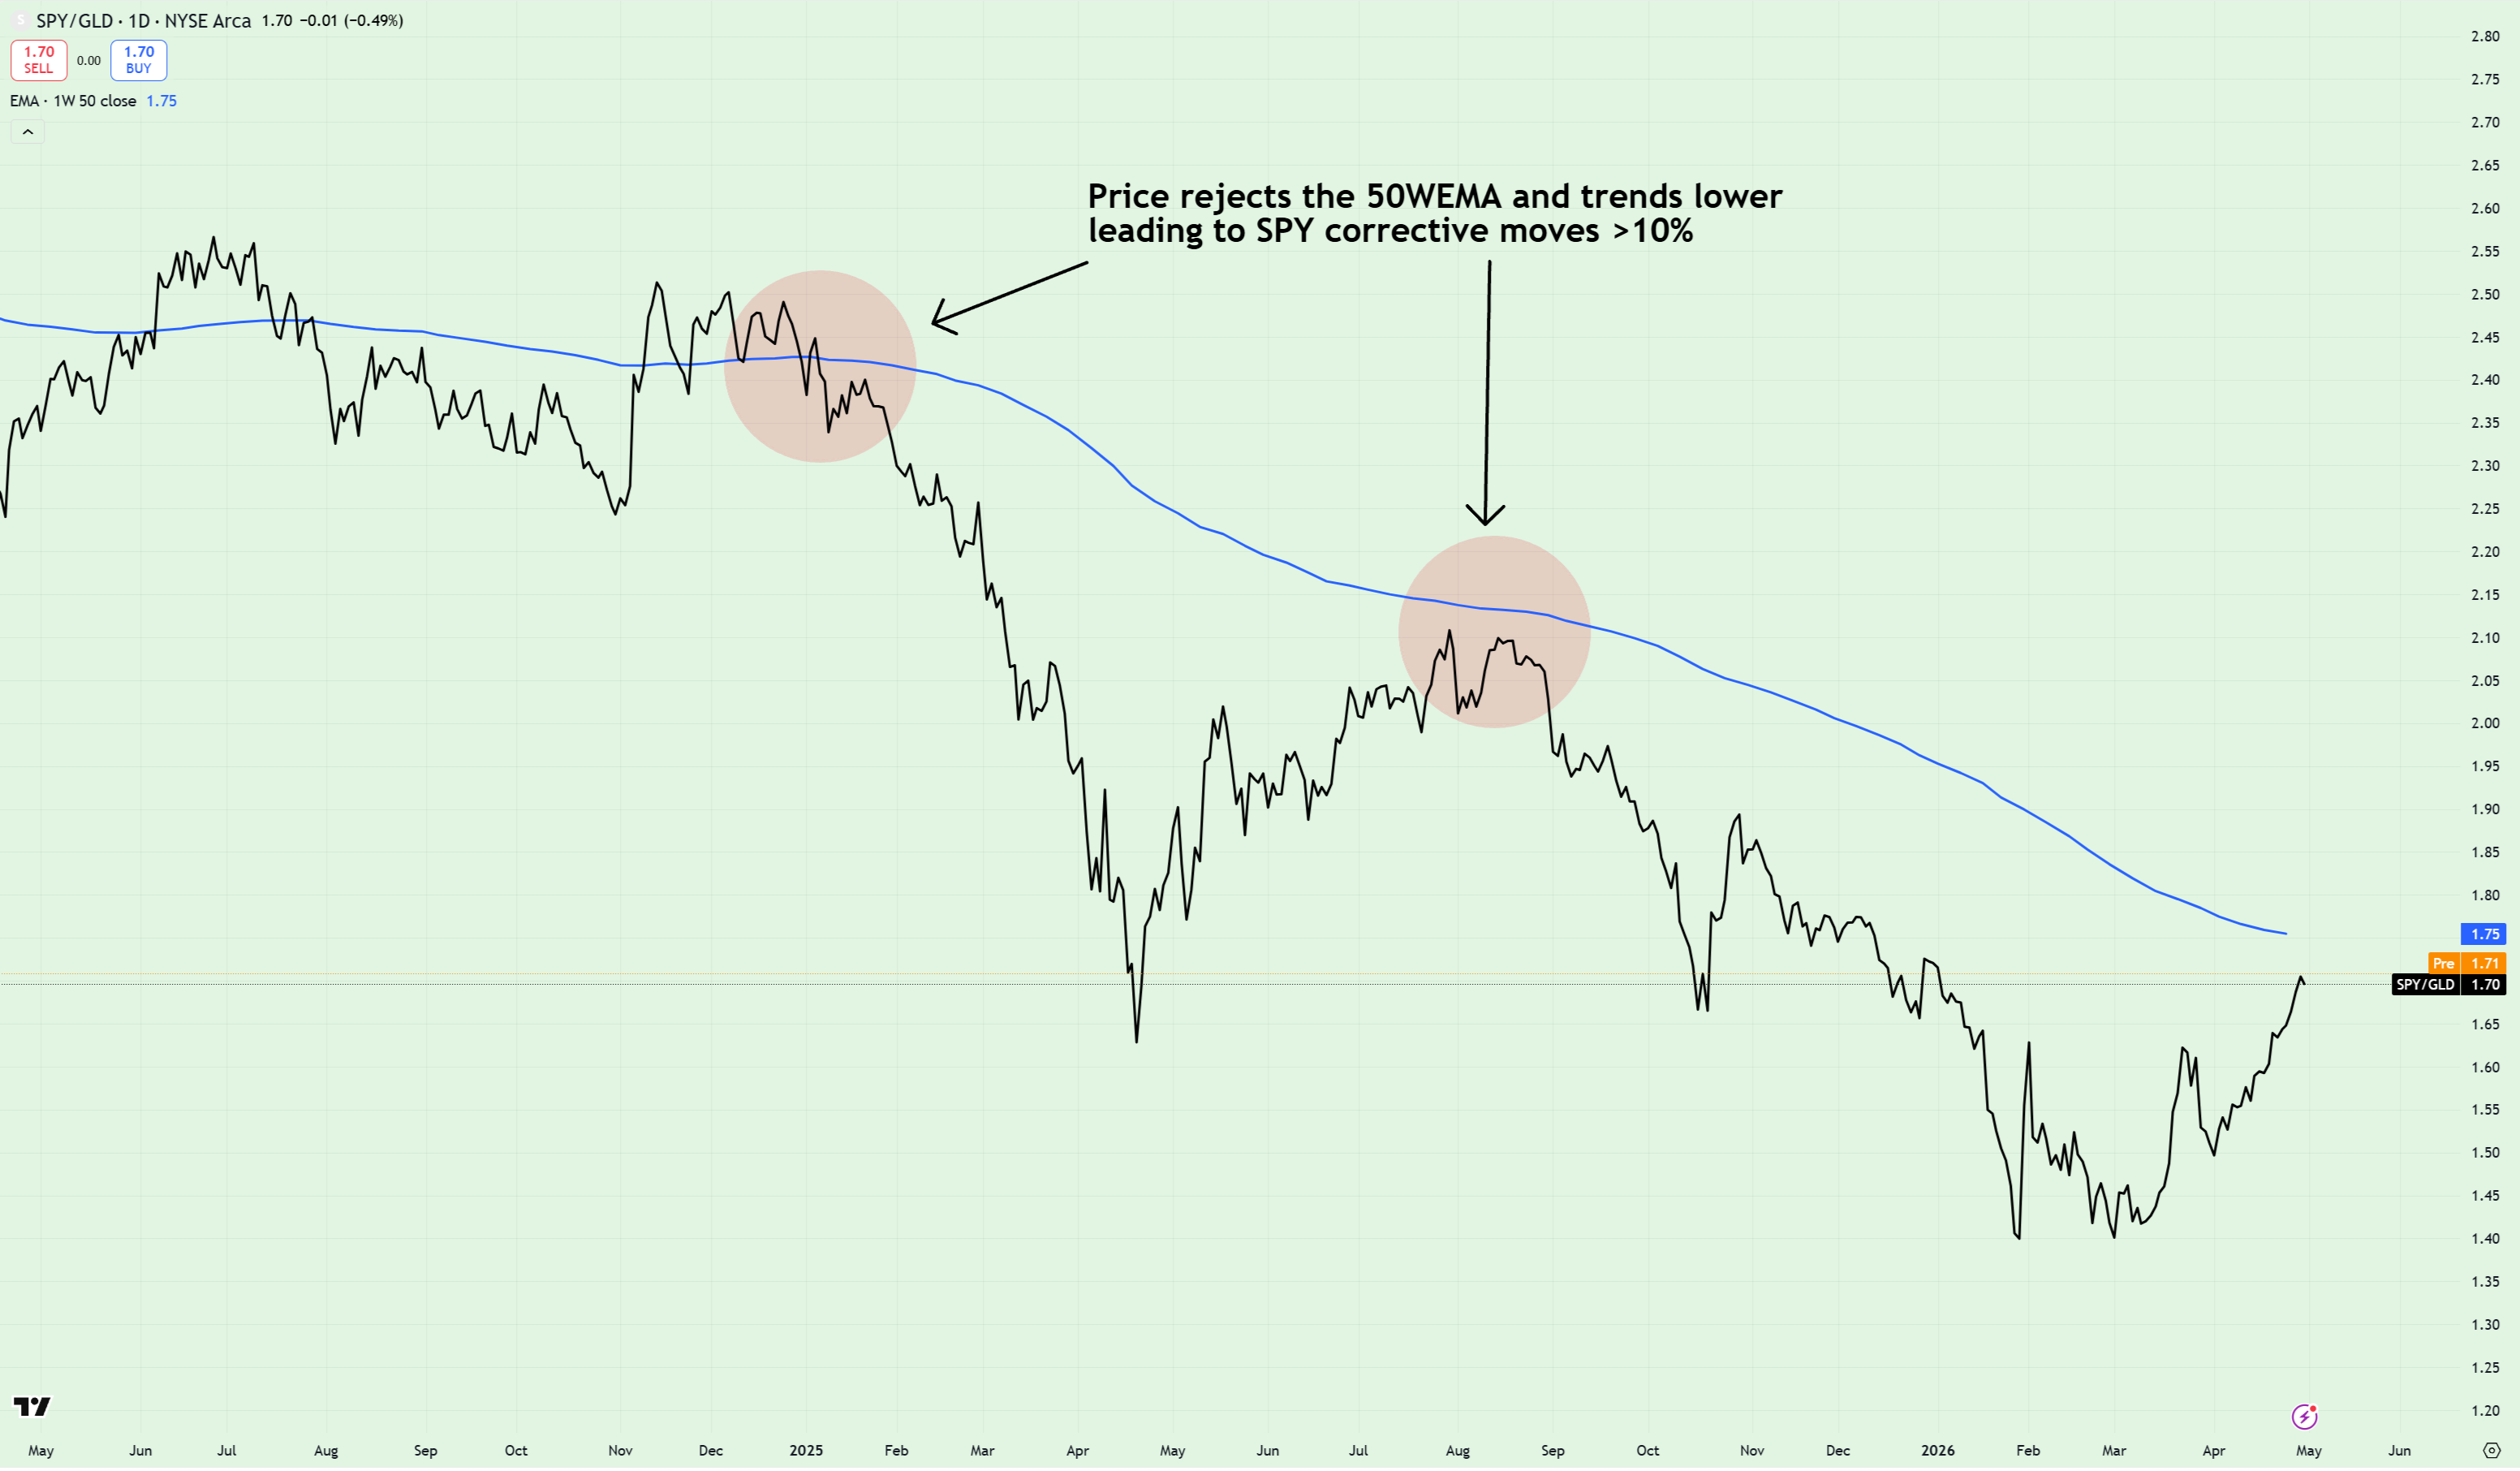
Before we get too giddy, like a hobbit kicking through the shire, it’s important to note that whilst the first part of the bargain has been upheld - SPY/GLD holding above the key pivot - the mission to Mordor remains incomplete at the time of writing.
As the chart above warns, when price rejects the 50WEMA from below and trends lower, corrective moves typically follow. Here’s how this relationship has translated on the weekly chart dating back to 2016…
“The Wise Speak Only Of What They Know”
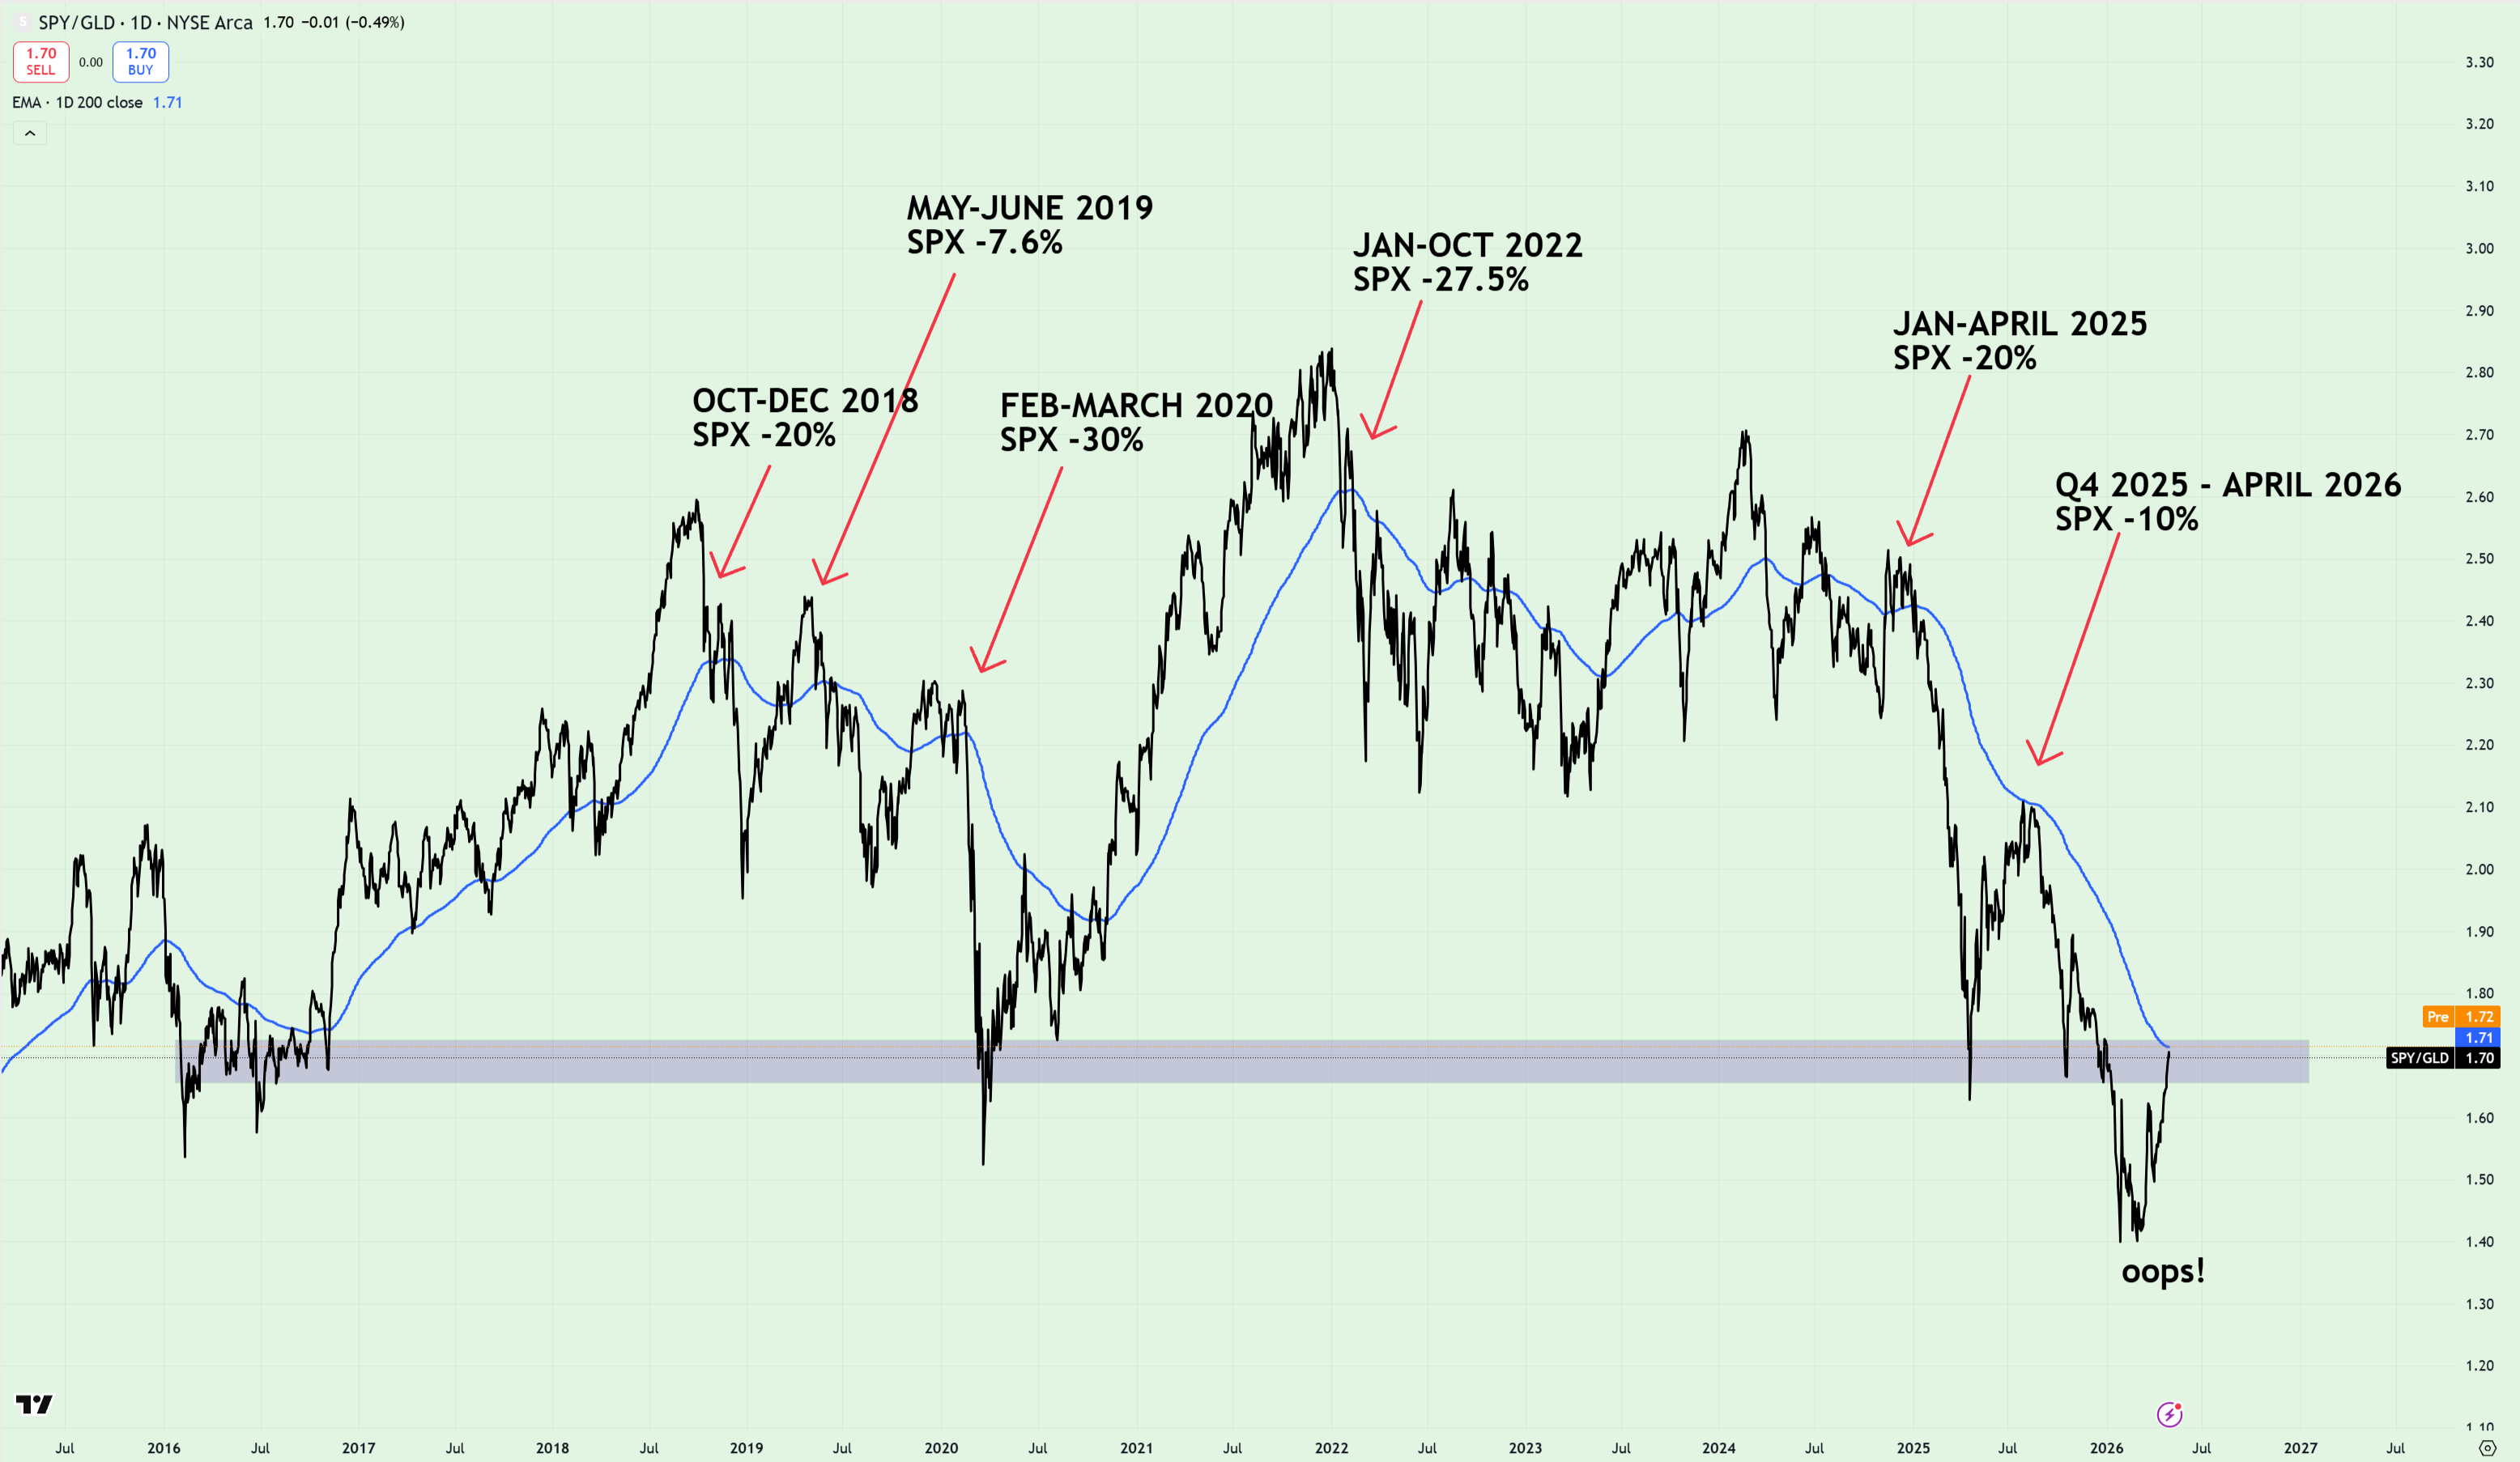
So which one is it?
Are we going to reject off the 200DEMA and lose our freaking minds or rip straight through it like Aragon’s sword?!
Well, markets rarely roll over on a whim. And for a corrective move or bear market to play out, a few essential ingredients are required.
A sprinkle of volatility. A helping of deteriorating breadth. Widening spreads etc...
But why tell you when I can just show you?
See those red bars on the chart?
They show instances where spreads were widening, vol was climbing and breadth was deteriorating - all pieced together in my primary risk composite indicator. Notice how we flipped from green, to orange to red prior to each of the corrective moves mentioned earlier?
But here’s the real interesting part - especially if you’re bullish. None of those things are present right now. So unless things take a severe turn over the coming days/weeks, don’t be surprised to see SPY/GLD reclaiming the 200DEMA - at which point, thanks to this handy post, you should know what to do.
Best,
Al