
The Bears Awaken
But can they break out?


In Kill Bill Volume II, my favorite scene shows the film’s main character buried alive.
Laying beneath six feet of earth, with only a torch and a knife on her person, ‘The Bride’ attempts to punch her way to freedom - emerging from looks like a desperate situation, breathless, moments later.
As far as metaphors go, it’s a great way of interpreting the price action that played out across risk assets over the last few weeks. The bears, buried without hope - reemerging from their slumber, gasping for breath.
Whether they can match ‘The Brides’ stamina and play out the remaining scenes of the movie - nobody knows for sure.
But one thing’s certain: that brief eruption from underground has changed the tone.
What looked like a one-way grind higher suddenly cracked. A fist through pine.
Was it a one-off jolt? Or the beginning of a proper breakout from below?
The clues, as always, can be found in the charts.
Clear Support Vs Resistance
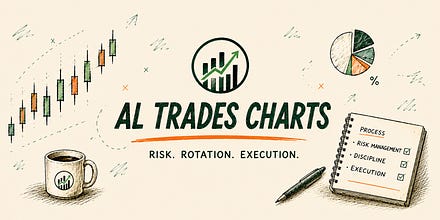
Here’s how we closed out the week on SPX, with price finding buyers at the 6550 yet again (note this is the fourth time bears have tried - and failed - to flush this level dating back to mid-September).
For bulls, holding price above 6550 therefore remains top priority heading into the new trading week.
Should that play out, the next level of interest sits at 6711 - right at the 50dma - a level buyers have failed to hold since November 14.
Above that, the AVWAP from the prior highs sits at ~6750, with the down gap from November 13 the last line of defense at 6841.
Should the bulls succeed in reclaiming these levels, we may see the bears - buried beneath the earth for the best part of six months - silenced once again.
Or at least that’s what the big accounts will tell you.
Don’t sleep on staples
I get it. Only price pays etc.
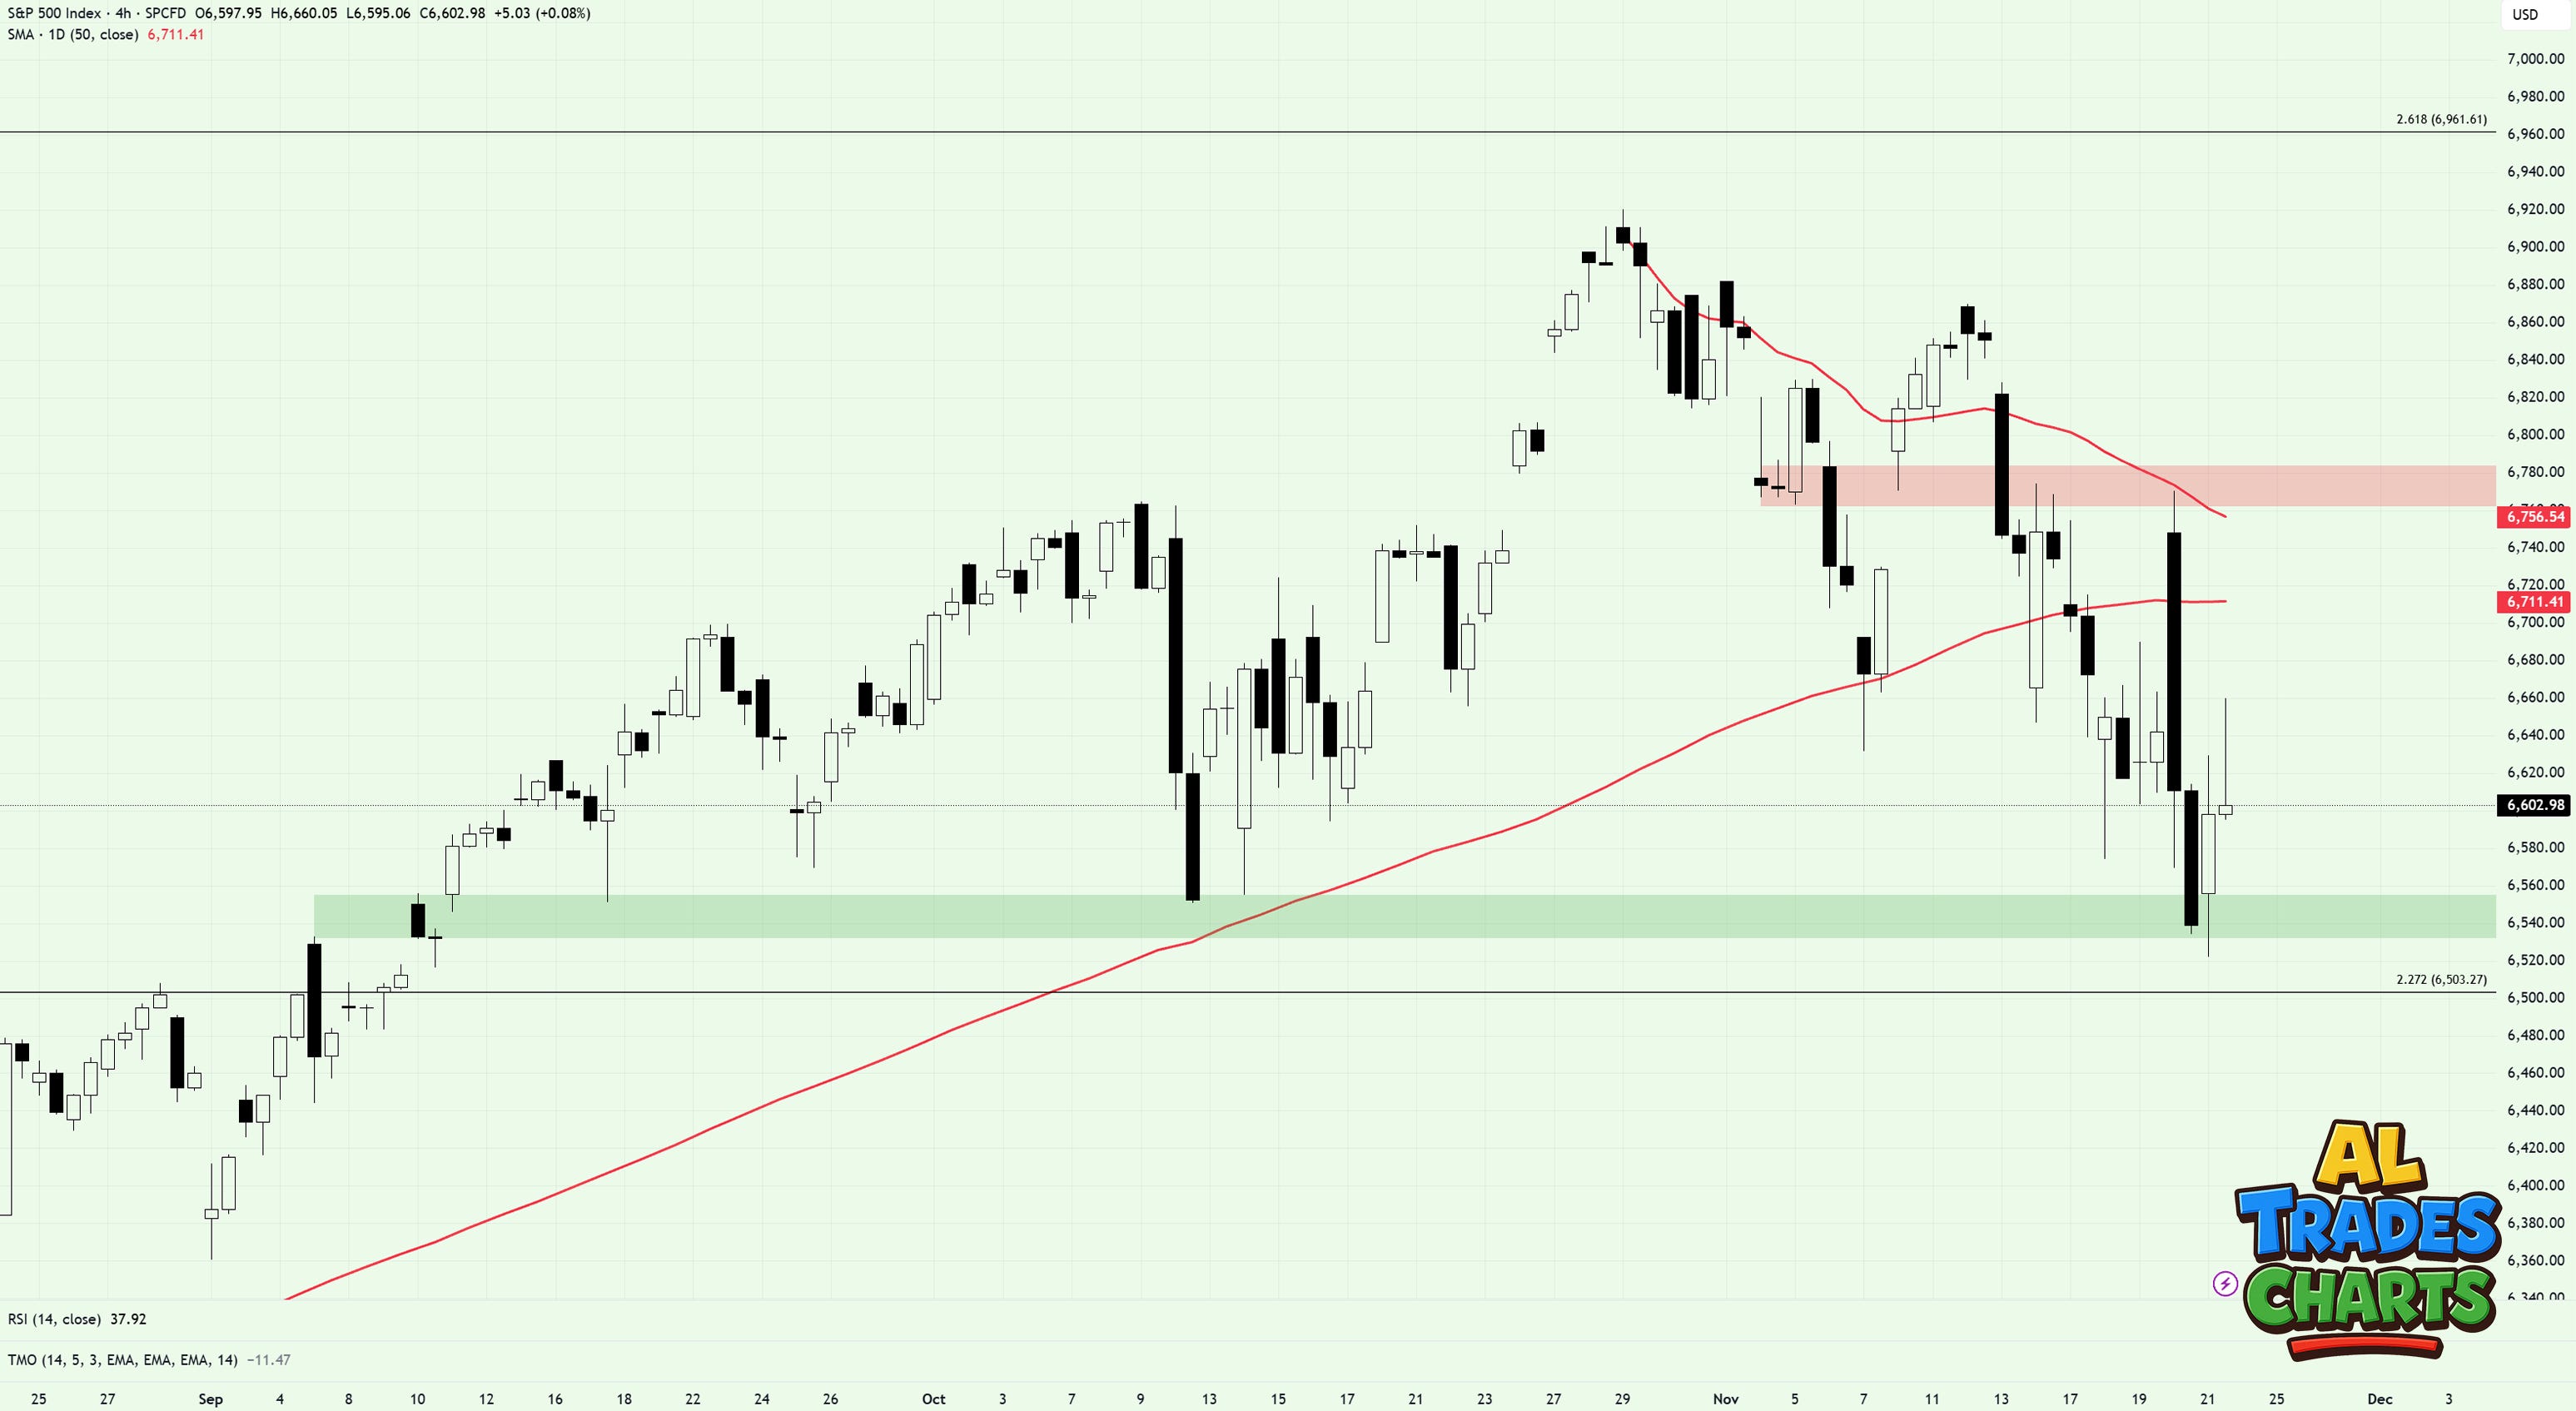
But what most traders fail to ignore is price action on tickers like SPY, QQQ and SPX relative to the wider market. That’s why I think this chart — showing XLP/XLY — is a secret weapon when understanding what’s actually transpiring under the surface.
What’s interesting here is that staples (stocks people buy when they’re fearful) relative to discretionary (stocks people buy when they’re bullish) achieved something earlier this month that it hasn’t managed since the April lows: it locked in a higher high and broke back above its 50-day moving average.
Could this be a countertrend blip? Absolutely.
But what if it’s not?
It all boils down to the prior pivot low.
Until that level breaks - the bears are still very much alive.
Volatility: higher lows and higher highs
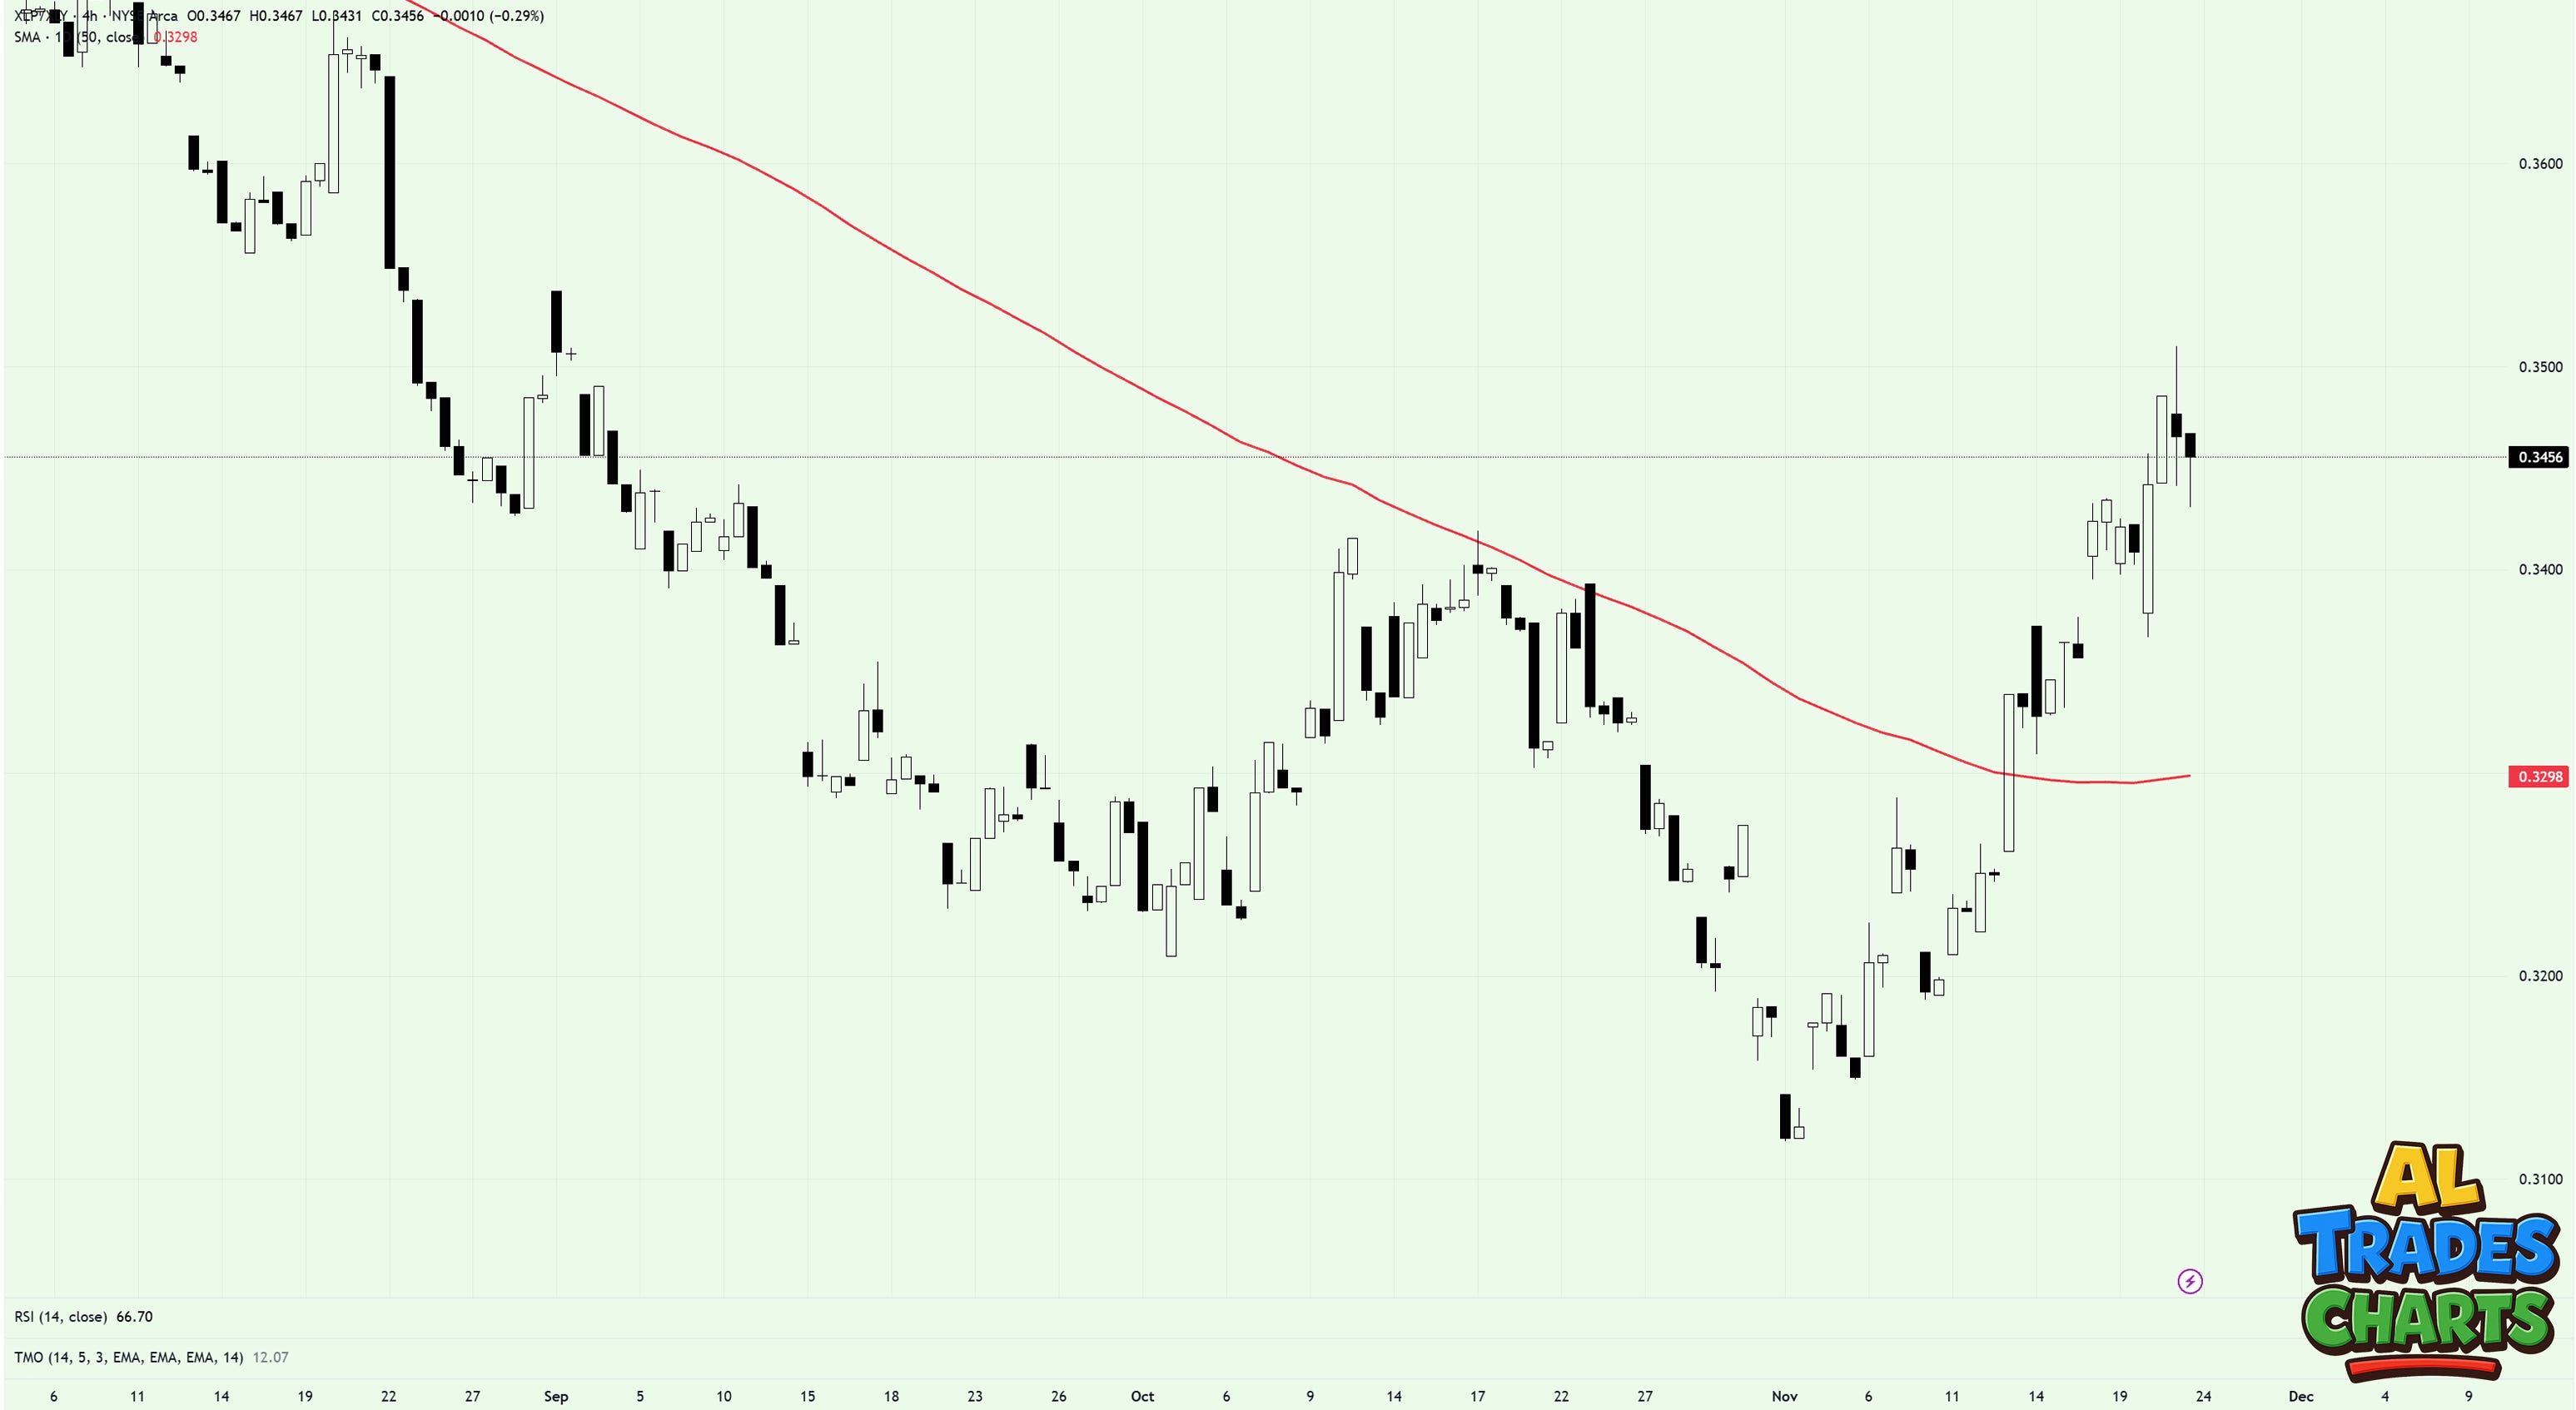
Need another ticker to show you the way? Don’t underestimate the VIX.
With volatility sitting in a clean uptrend since late October, the sell-off that transpired last week shouldn’t have come as a surprise. Especially if you’re subscribed to this newsletter!
How does this relate to SPX, SPY and QQQ, exactly?
When the VIX makes a new high, you want to see SPX making new lows - as has been the case since SPX hit the ATH level on October 29.
So if you’re bullish - you need the inverse to play out. You want lower lows and lower highs on the VIX - a feat that’s yet to be achieved this month.
Thankfully, unlike XLP/XLY which can be a little sluggish for short term swing traders, the nature of the VIX makes it a great tool in understand current market sentiment on an intraday basis.
Keep an eye on the prior swing low at 19.28 this week for clues for future direction. If the VIX drops below this level and then makes a lower high (sub 28.27), then a continuation of the uptrend that’s been in play since April remains in play.
Should price hold above 19.28, be careful - even if SPX makes a new high.
So what’s the trade?
I’m heading into Monday with two positions: RIOT (15C expiring Jan) and LULU (180C expiring in 3 weeks). Nothing fancy. Nothing heroic. Just enough exposure to keep me in the fight.
While everyone on X seems intent on guessing the exact moment the coffin lid cracks, I’d rather stay mostly in cash — crouched, focused, waiting for the thud that matters.
No coin-tossing. No drama.
Just patience and live ammo.
The levels in this post are my map: VIX and XLP/XLY for the short-term pulse, breadth and credit spreads for the deeper structural read.
And right now, a lot of tickers are buried in oversold territory… which makes a bullish week more likely, but also more fragile.
If we get the bounce I’m anticipating, the prior highs on SPX — and the prior lows on XLP/XLY and VIX — will tell us whether the market’s breaking out or simply punching once before collapsing back into the dirt.
Sure, I’d love to see SPY tag 694–715 by year-end.
But wanting doesn’t make it so.
My job is simple: watch the signals, trust the map, and be ready when the fist finally breaks through the wood.
Have a great week.
Al