
The Perfect Storm
Emergency Newsletter


Calling market tops is one of the hardest games in trading. Markets rarely roll over in dramatic fashion - instead, they shift. Slowly at first, then…pop.
For weeks, I leaned bullish. IGV and ARKK both caught bids where I expected. But with those trades now closed, quality bullish setups are becoming harder to find.
It feels a bit like The Perfect Storm. The skies may not look catastrophic yet, but the pressure is building. The ship keeps moving - even as the conditions slowly change beneath it, ever hopeful that the next big catch is just around the corner.
Maybe this is still early, with more upside ahead.
Or maybe the tide has turned. Nobody knows for sure.
What I do know is this: for the first time since November, both of my Risk Models are flashing red — despite the market sitting just 2% from all-time highs.
Not a top call.
But a clear shift in conditions.
Risk Model 1: Red Zone
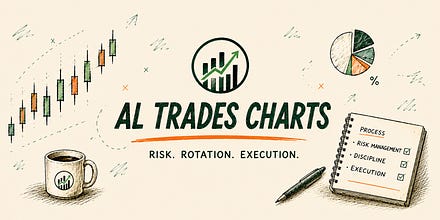
Risk Model 1 blends three key market stress gauges — each tracking a different layer of market health: spreads, VIX and breadth. It’s a fairly primitive instrument, but one that has served me well when assessing the market’s overall health.
In instances where no bar is shown on the top panel (I call this the clean air zone), dip buying has proven to be the winning strategy. But right now we’re in the red zone, meaning that all three of the following conditions have been met:
The VIX is above the 50dma
The % of S&P500 stocks trading above the 50dma has fallen below the 50dma
Credit spreads are above the 50dma
Risk Model 2: Red Zone
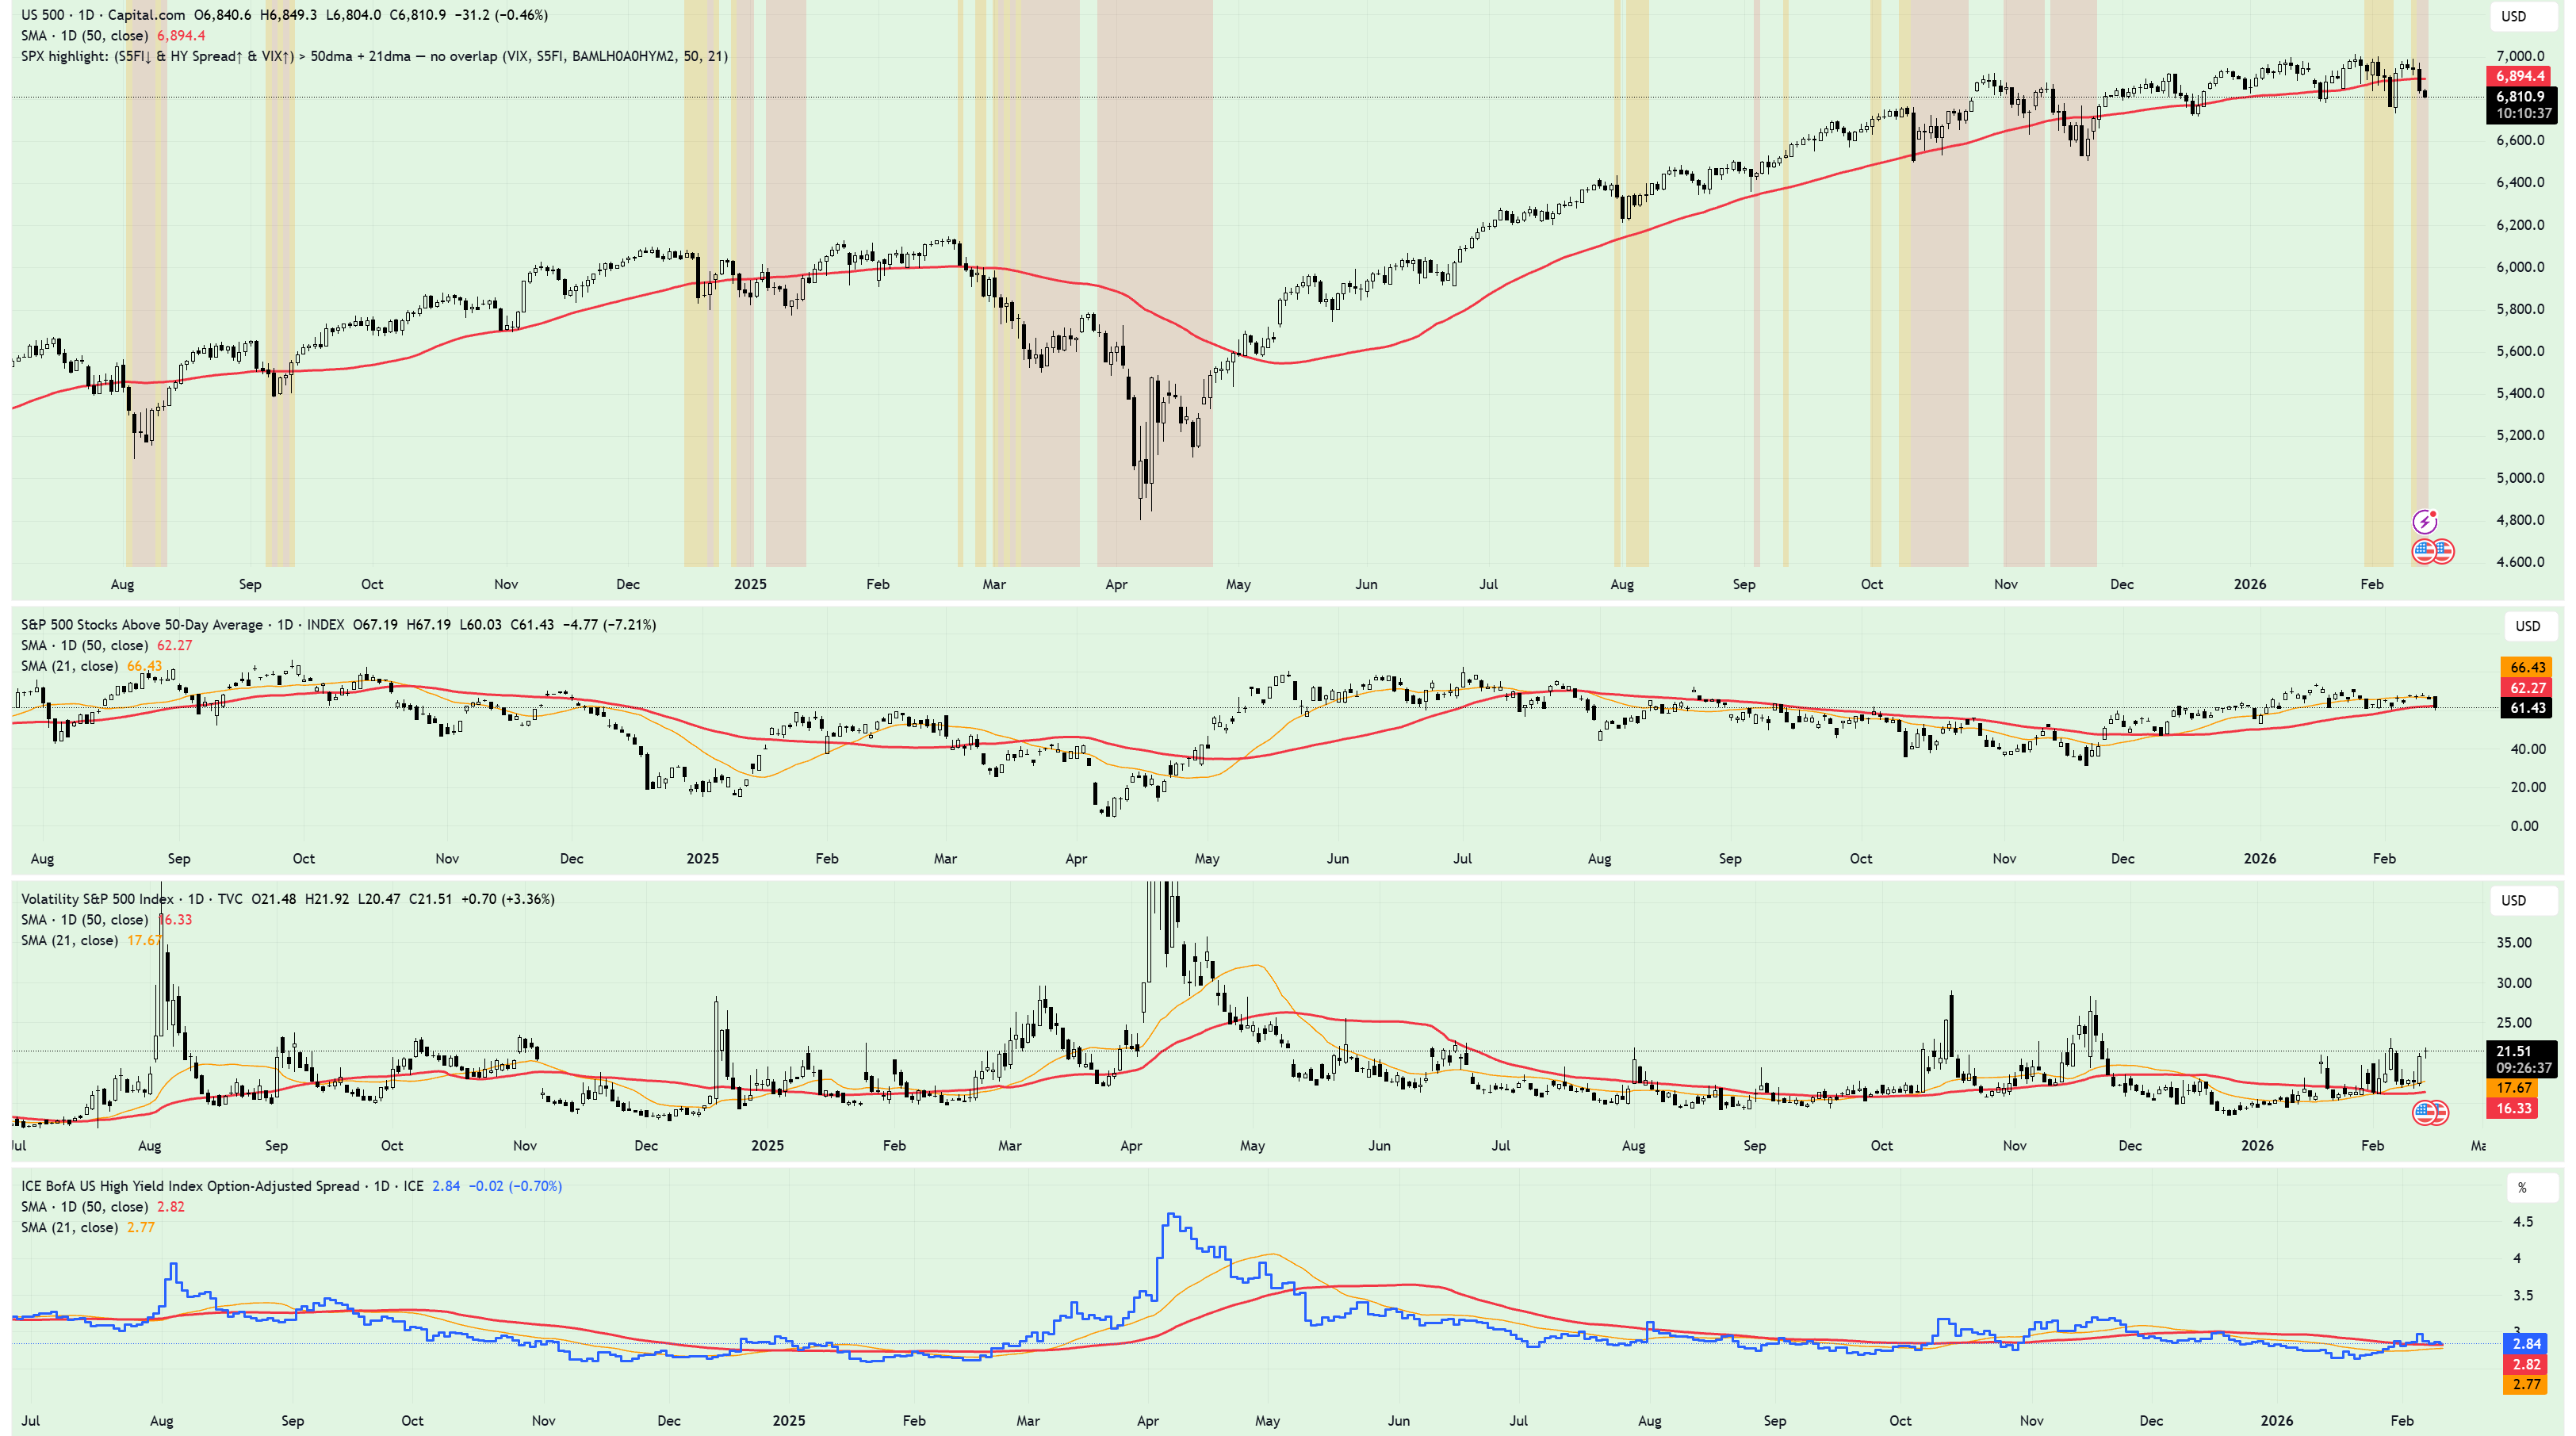
Like the example above, Risk Model 2 also blends three key market stress gauges: XLP/XLY, TLT/SPY, VIX.
Again, in instances where price has traded in the ‘clean air’ zone, dip buying has worked like a charm. But like Risk Model 1, we’re now deep in the red zone, signaling that all three of the following conditions have been met:
XLP/XLY is trading above the 50dma and making higher highs on short term timeframes
TLT/SPY has reclaimed the 50dma for the first time since November
VIX is extended above its 50dma
Who’s steering the ship?
For months now, the market has drifted sideways - a long, grinding consolidation that’s been in play since October. Plenty of movement. Plenty of noise.
But very little real progress.
And the truth is, neither side has truly taken control.
The bulls have had their chances. Breakouts that should have followed through faded. Strength that should have expanded instead narrowed. Momentum that should have accelerated stalled.
But the bears haven’t delivered either.
Each selloff looked like the start of something bigger - until it wasn’t. Breakdowns failed. Fear faded. Dip buyers stepped back in. Time and again, downside momentum proved fleeting.
So here we are - months later - with price still trapped in the same broad range, and no decisive winner to show for it.
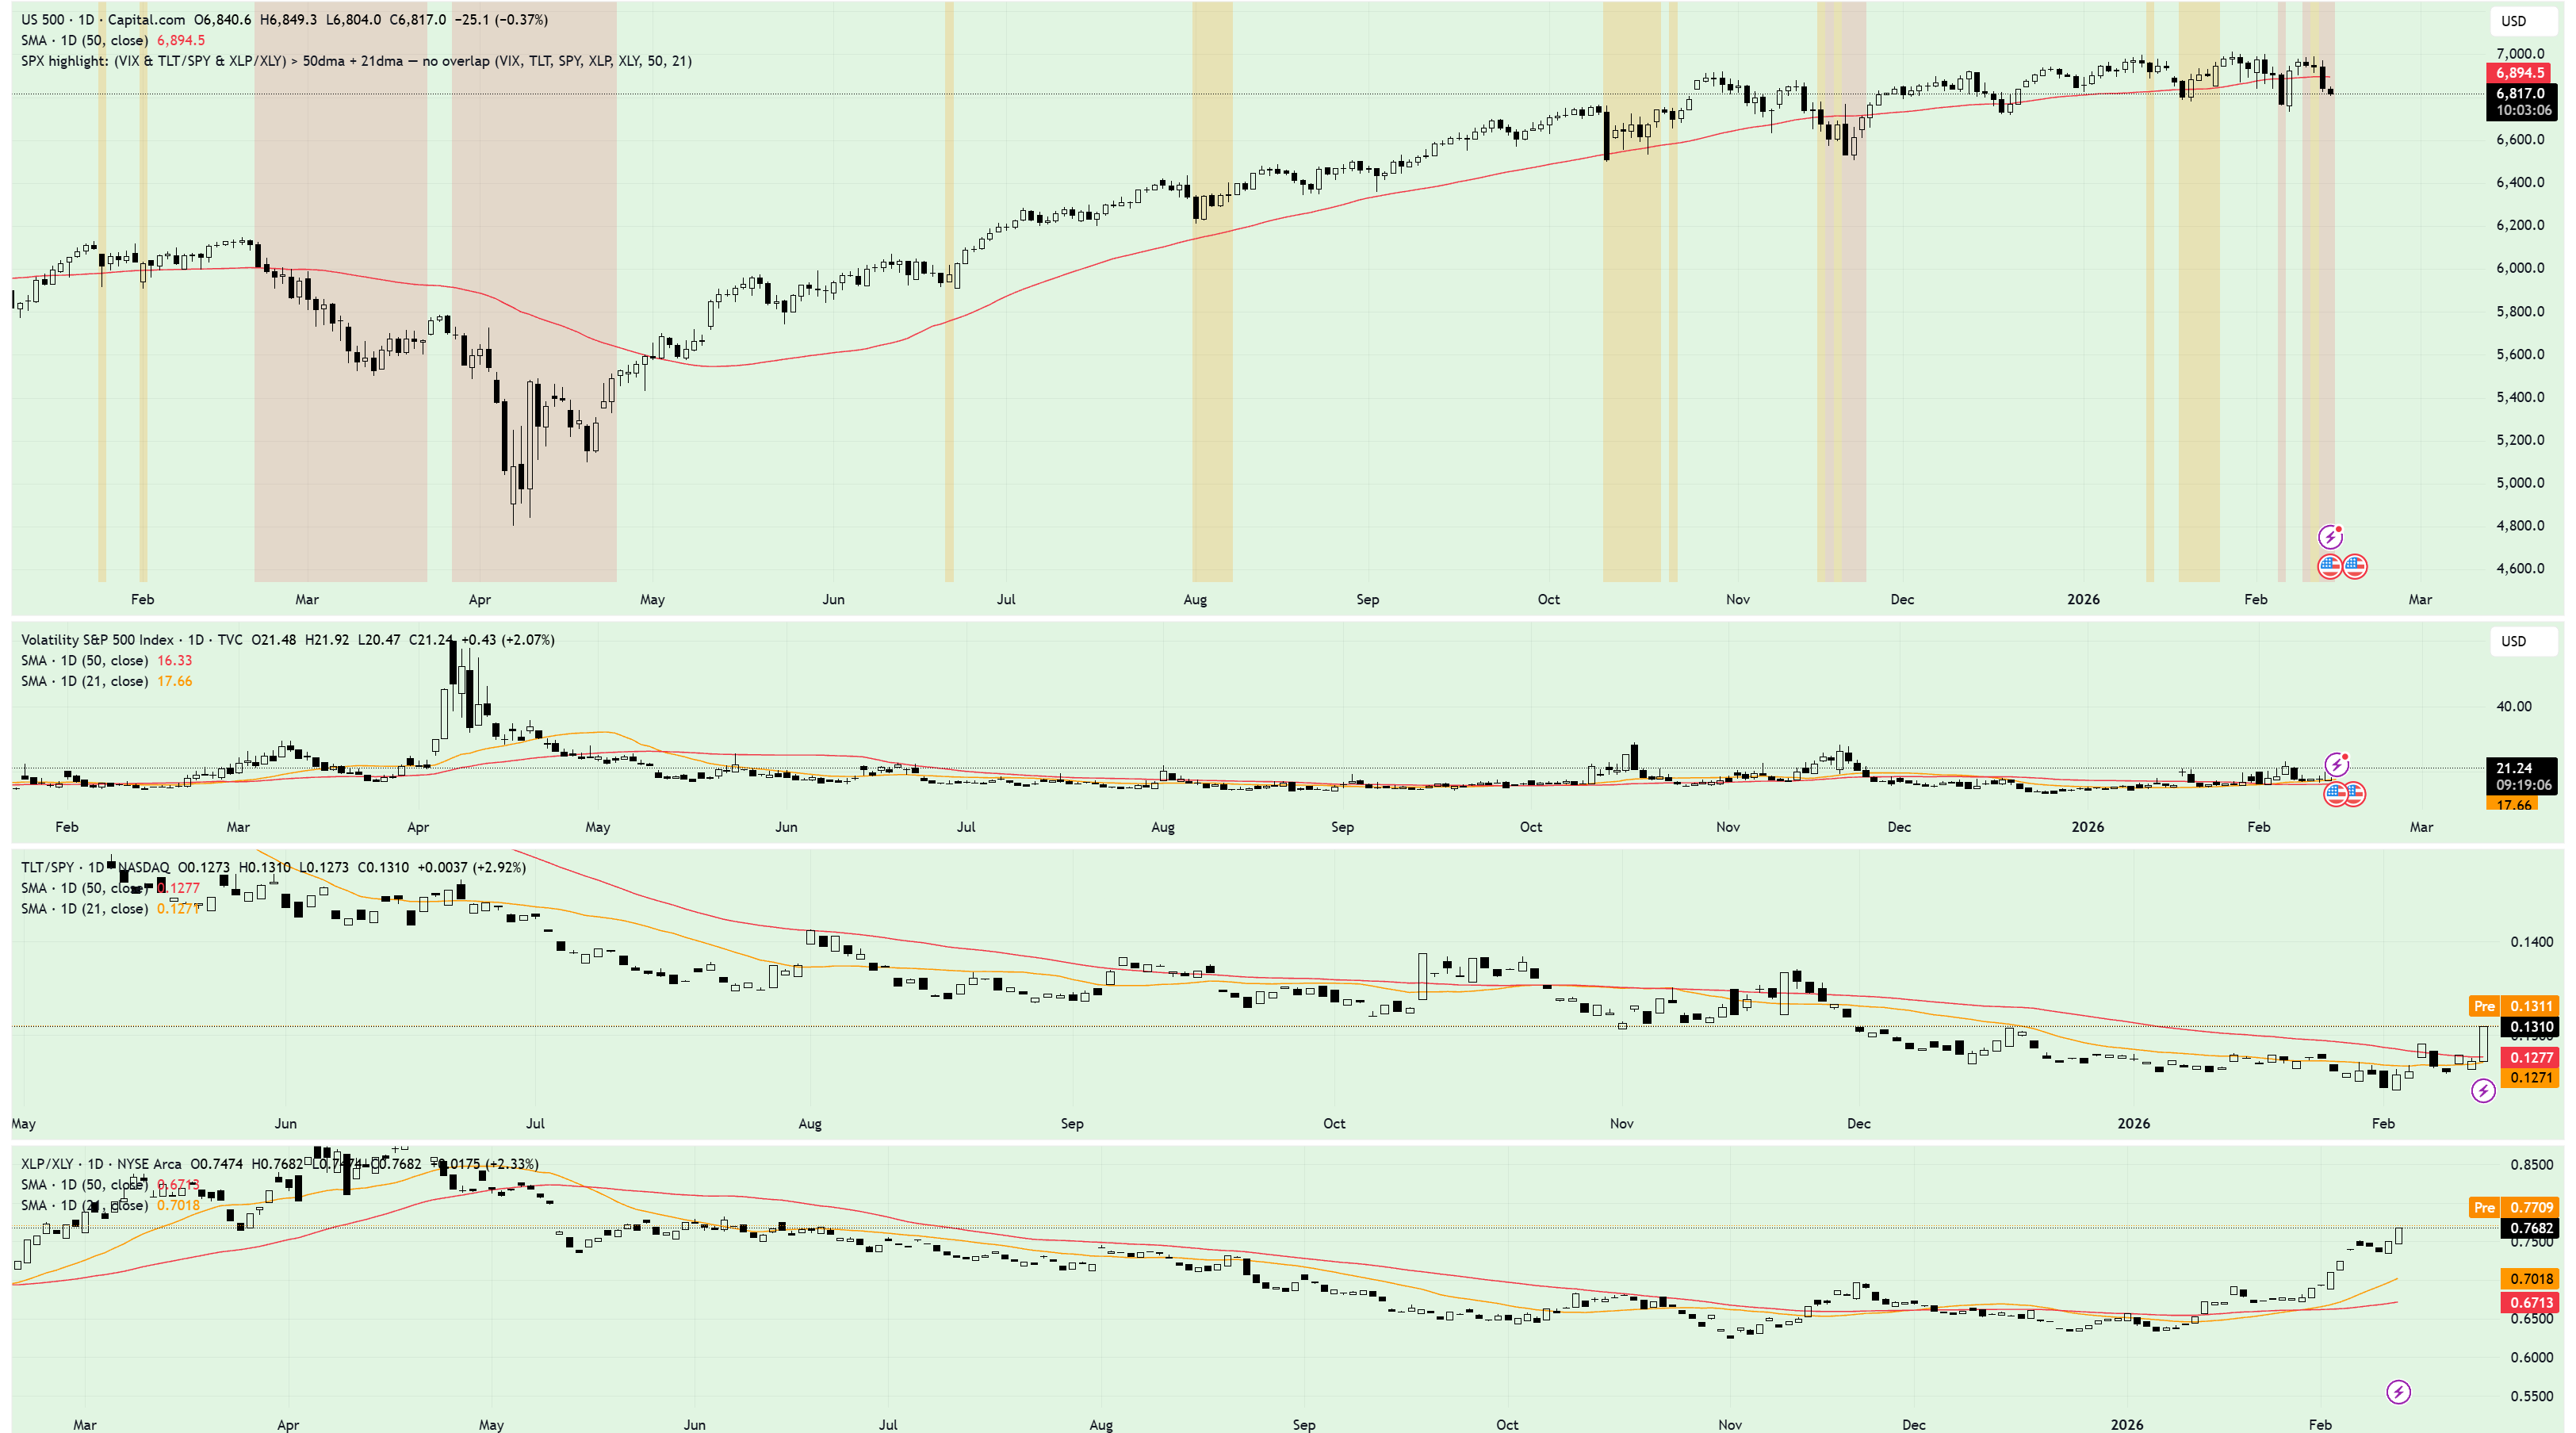
But if there’s one chart worth paying attention to right now, it’s this one:
It’s something I bring up all the time, because it’s super important.
When XLP/XLY fails to the downside and SPX makes a new high - as was the case earlier this month - bulls typically find themselves in deep water in the weeks and months that follow.
What’s notable to me here isn’t the divergence itself - it’s the sheer magnitude of it.
To put it into context, SPX is less than 2% from all time highs, whilst XLP/XLY is trading at the same level as June last year - when SPX was trading just above 6,000.
That kind of divergence is difficult to ignore, especially given the weight of evidence that’s beginning to stack in the bear’s favor:
Crypto entered a bear market, with Bitcoin shedding more than 50% in three months
Prior market leaders, most notably in tech and financials - are the worst performing sectors YTD
Energy, materials and staples continue to roar higher, signaling one of the most obvious rotations out of risk assets into safer, low debt sectors
Volume on down days is outpacing volume on up days - a classic distribution signal
None of this confirms a top - and if CPI comes in cooler than expected during today’s session, don’t be surprised to see SPX trading back above 6900 in a flash.
But what’s becoming abundantly clear the more time we chop in this range is that the bearish thesis is becoming harder to ignore.
Because when the storm finally arrives, the signs always look obvious - in hindsight.
Best,
Alex