


From where I’m sitting there appears to be two dominant narratives jostling for position in the market.
The first camp is the more obvious one.
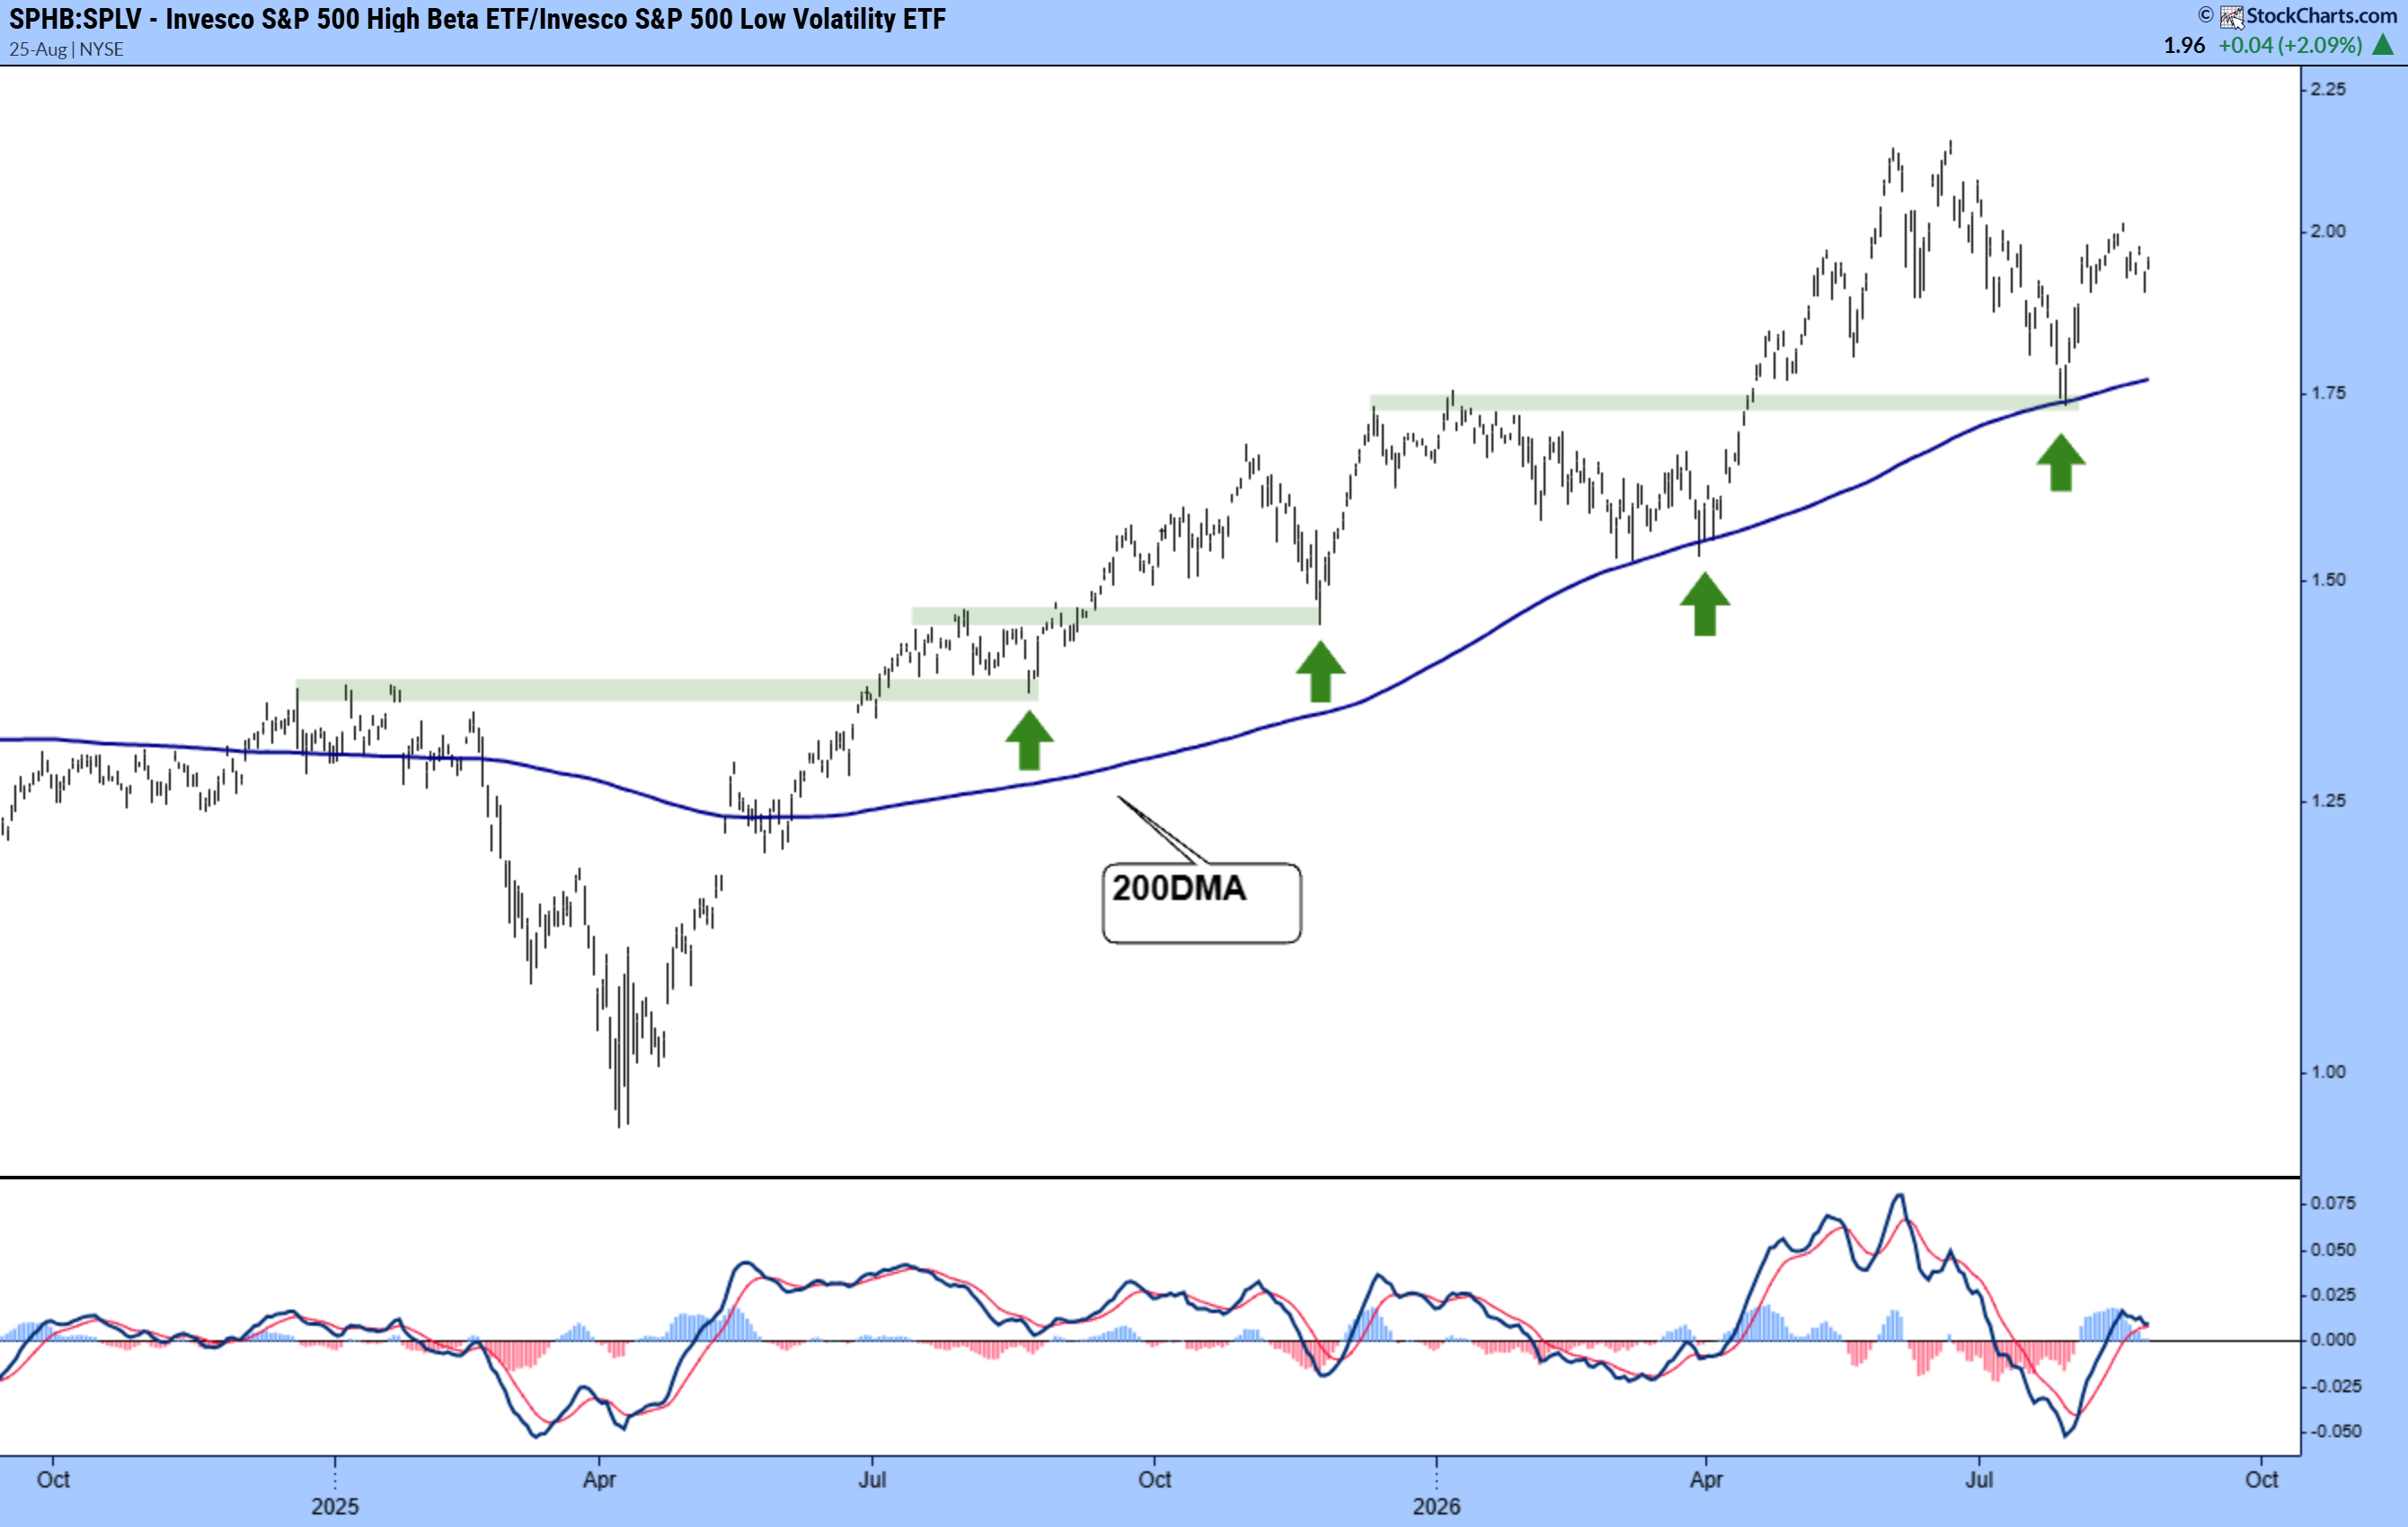
With technicals supporting moves up-and-to-the-right, buyers are hoovering up risk assets above key MAs and VWAPs, best demonstrated by the chart below which shows high beta relative to low vol delivering one of the cleanest uptrends you’re likely to see anywhere in the market.
On the other side of the debate reside the commodity bulls and bond bears. For these guys, Iran plays a prominent role - with rising energy costs continuing to validate their thesis.
Don't believe me, go check out diesel and heating oil prices. Oh and then there's silver and copper, both essential in the ai trade, while gold does it's thing as an inflation hedge, or so the narrative goes.
What’s weird - to me at least - is that throughout Q2 and thus far in Q3 both theses have delivered to a certain extent, with the occasional outlier in both camps (crypto and gold, up until recently, software etc.).
So the question I'm asking myself here, somewhat perplexingly given where indices are at, is whether or not both can sustain into year end.
And which, if not both, ends up in the weeds?
Shit, or get off the pot
This week we’ve got two potential market movers that could help determine which side of the tape we want to be on heading into Q3’s twilight zone.
First up we’ve got NVDA reporting after today’s close (Wednesday August 26).
After that, we’ve got Fed Chair Warsh delivering his latest market musings at Jackson Hole both on Friday and over the weekend.
Until the market has had time to digest both, I’m seeing little to no reason to position myself too aggressively - and have instead taken the opportunity presented to me in this here August lull to build some tools, assess some charts and set my stall out for what likely comes down the road.
And while you’ll have to wait for the tools I’m working on to drop (all will be shared for free in due course), you’ll be pleased to know that the charts I’ve been monitoring for clues as to which way the market wants to go heading into the midterms look primed and ready for an outsized move.
Let’s dive in.
Bonds, yields and peak hawkishness
A few months ago I wrote a piece detailing a thesis coined ‘peak hawkishness’, in which the basic premise argued that some of the rhetoric we were getting out of the likes of Bank of America and Citadel (lol!) was way off the mark.
Two rate hikes, seriously?
Since then, things have changed - and not necessarily for the worse.
What changed? Bessent changed.
And while I’m reluctant to go into too much detail on the Treasury’s decision to bid the long end of the curve - I’m not an economist nor a bond market aficionado - I don’t think you can ignore some of the moves that have played out in the market since last week’s announcement.
Which brings us to…Bitcoin
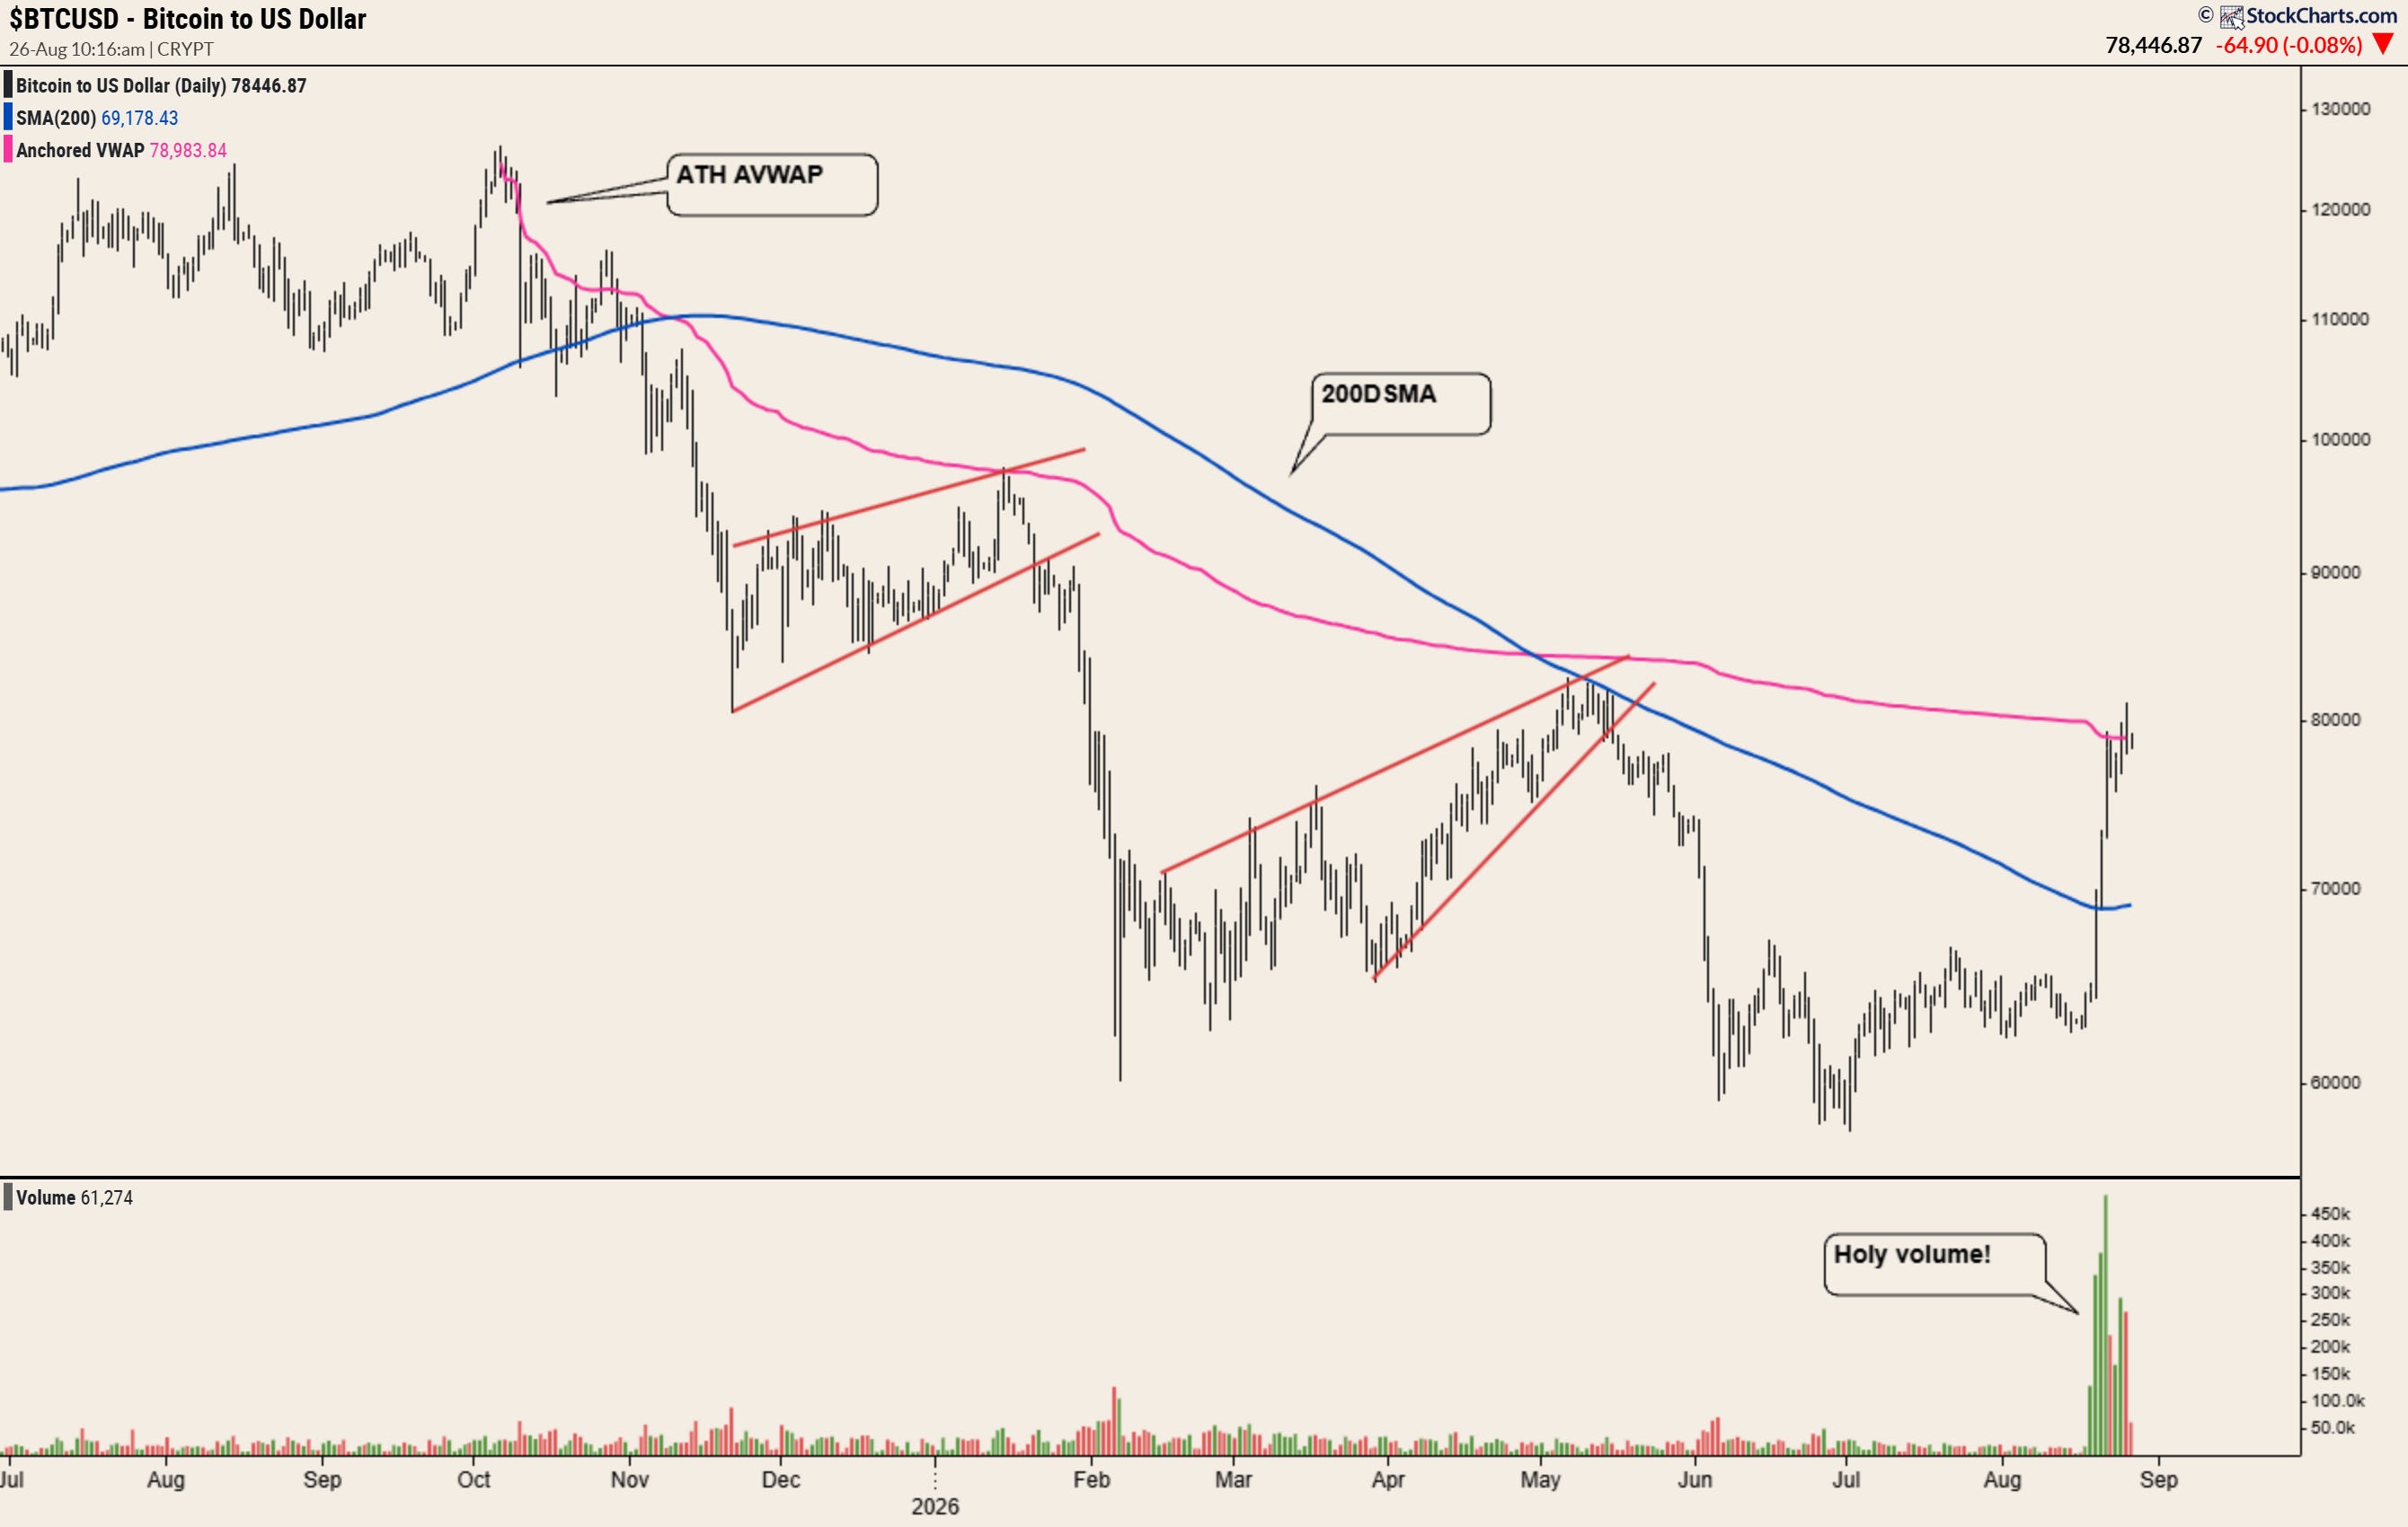
What we’re seeing here is a potential change in character from the trend that’s been in play since Q4 of last year. Sure, the absence of a higher high remains, as does a higher low, but in my view it’d be foolish to simply ignore the huge volume spike, price action and break above the 200dma that’s played out over recent weeks inspite of this.
Am I buying Bitcoin right now? No sir.
But what I am doing is monitoring the chart for clues moving forward.
Why?
Regardless of what you’ve read on Reddit, Bitcoin isn’t some mythical inflation hedge operating in isolation from the rest of the market - it’s one of the clearest expressions we have of broader risk appetite.
And if it can therefore reclaim the key AVWAP from the 2025 high and establish a new bullish trend, I’d take that as a pretty compelling signal that the risk-on environment is broadening, with risk assets across the board likely to benefit.
And if Bitcoin moves…
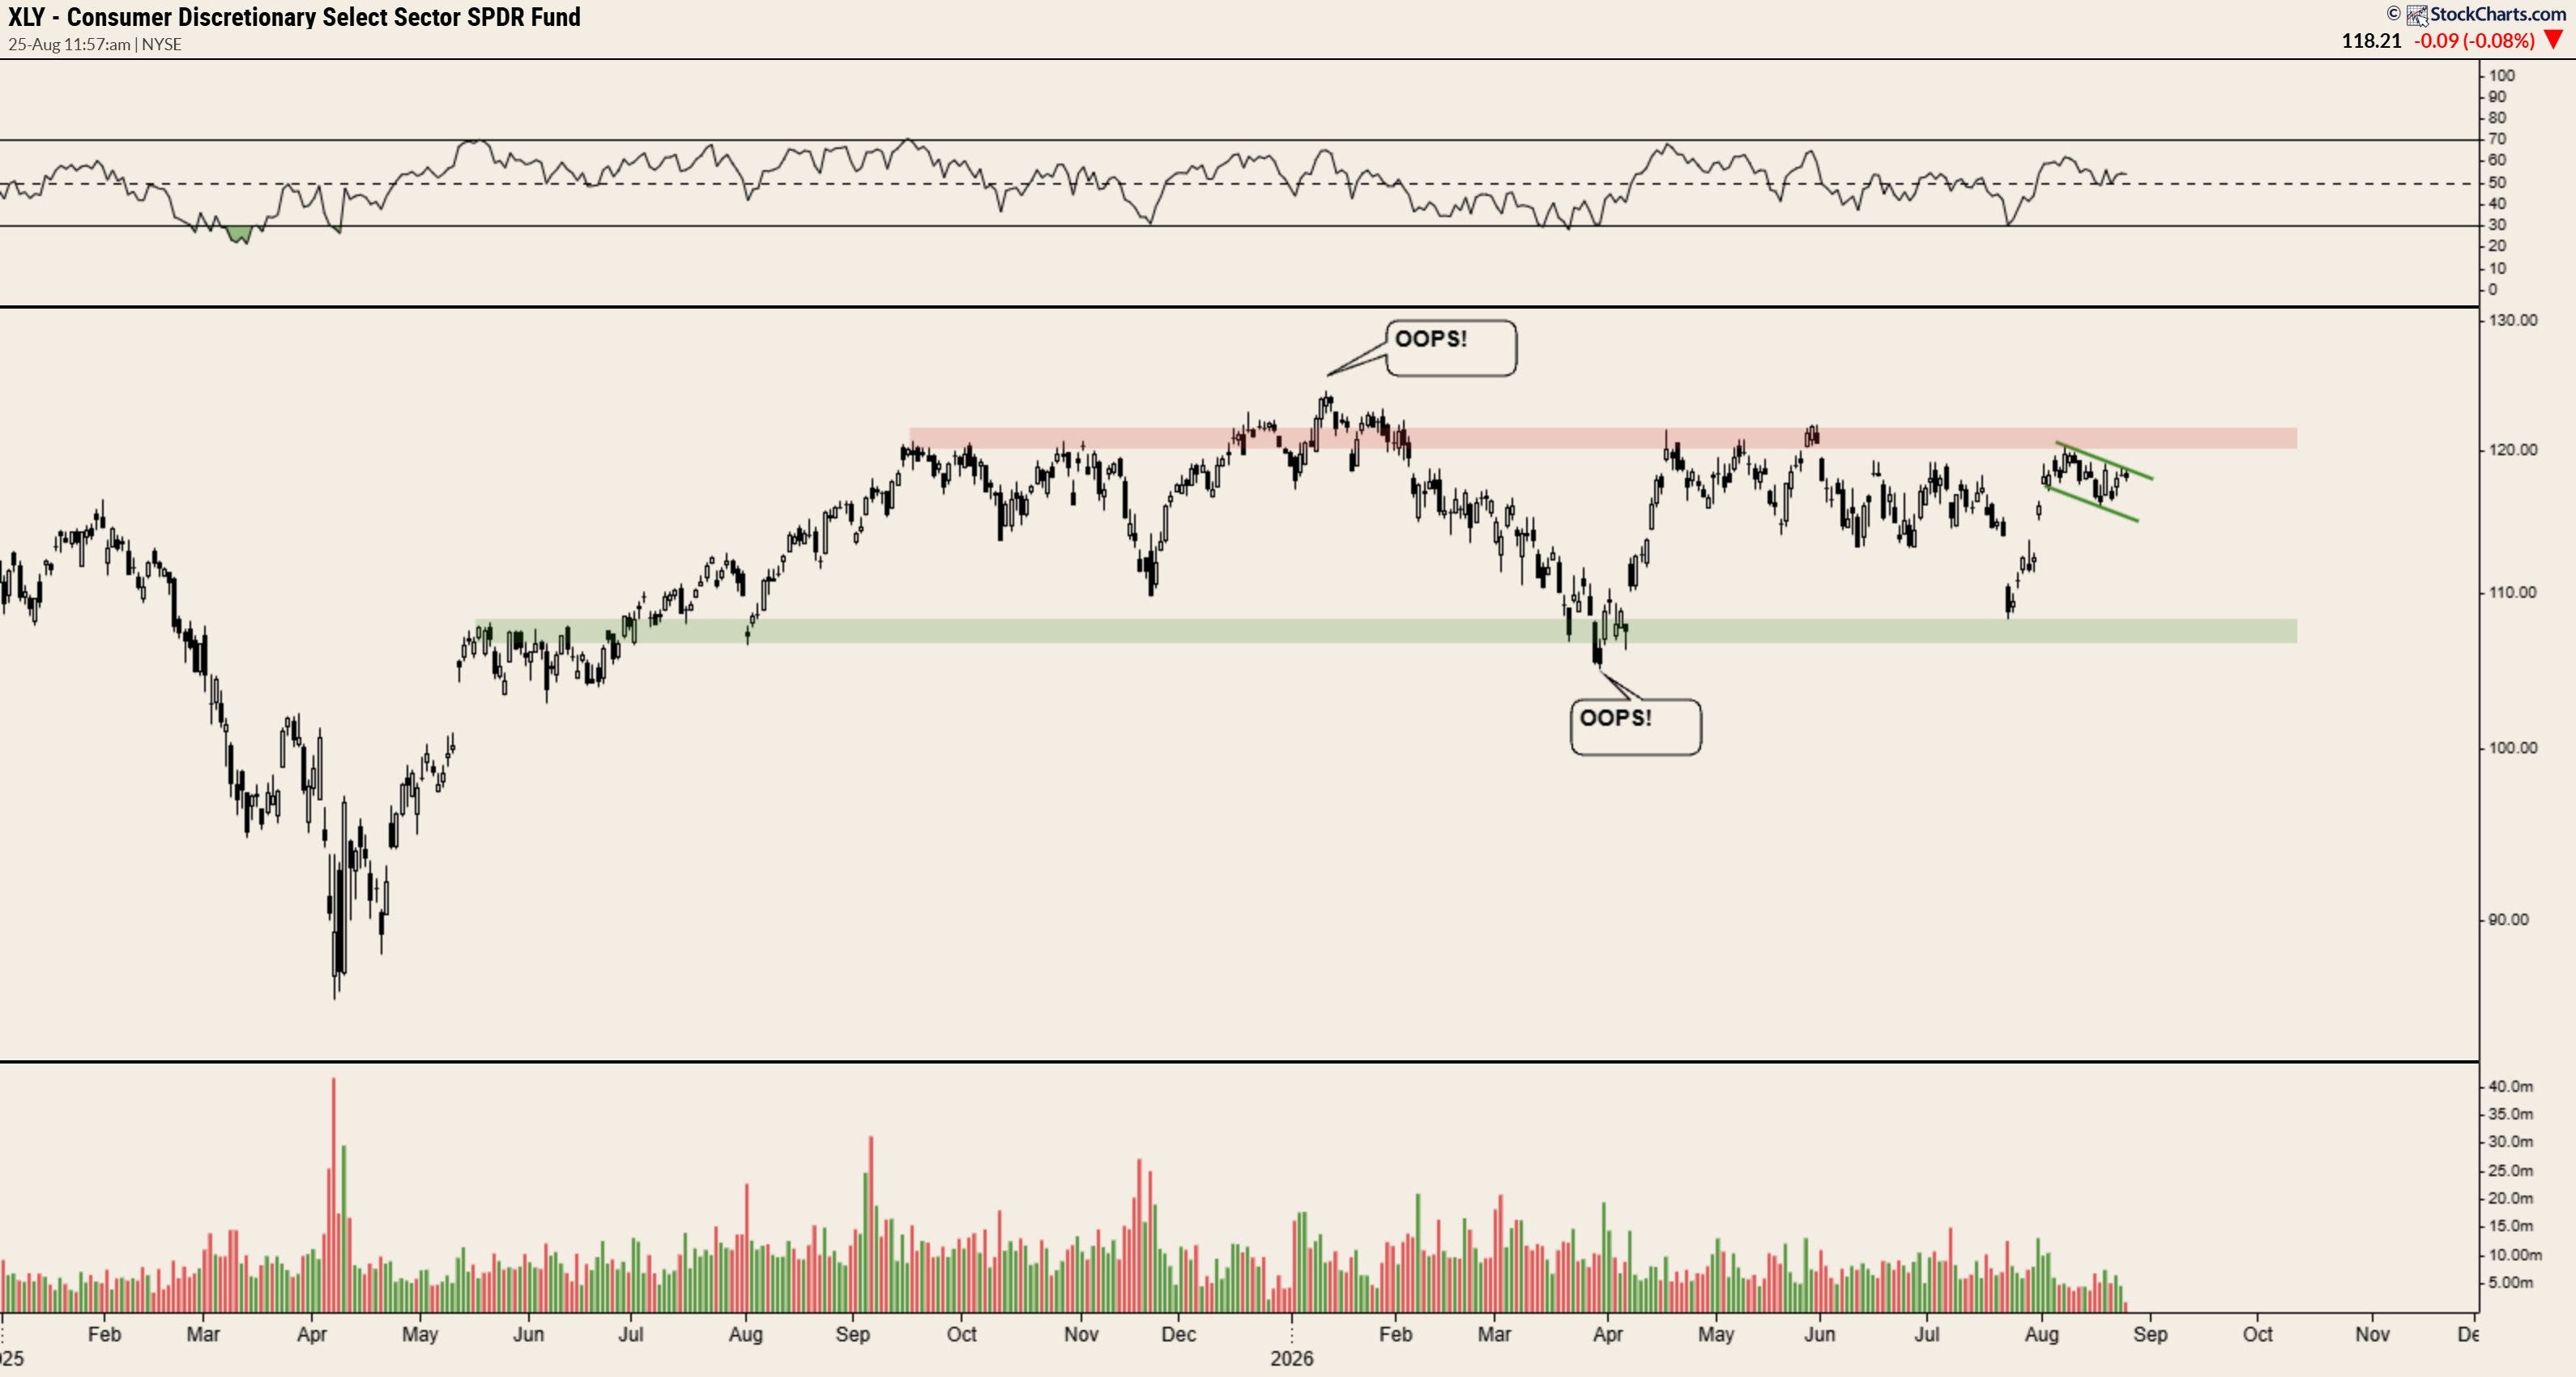
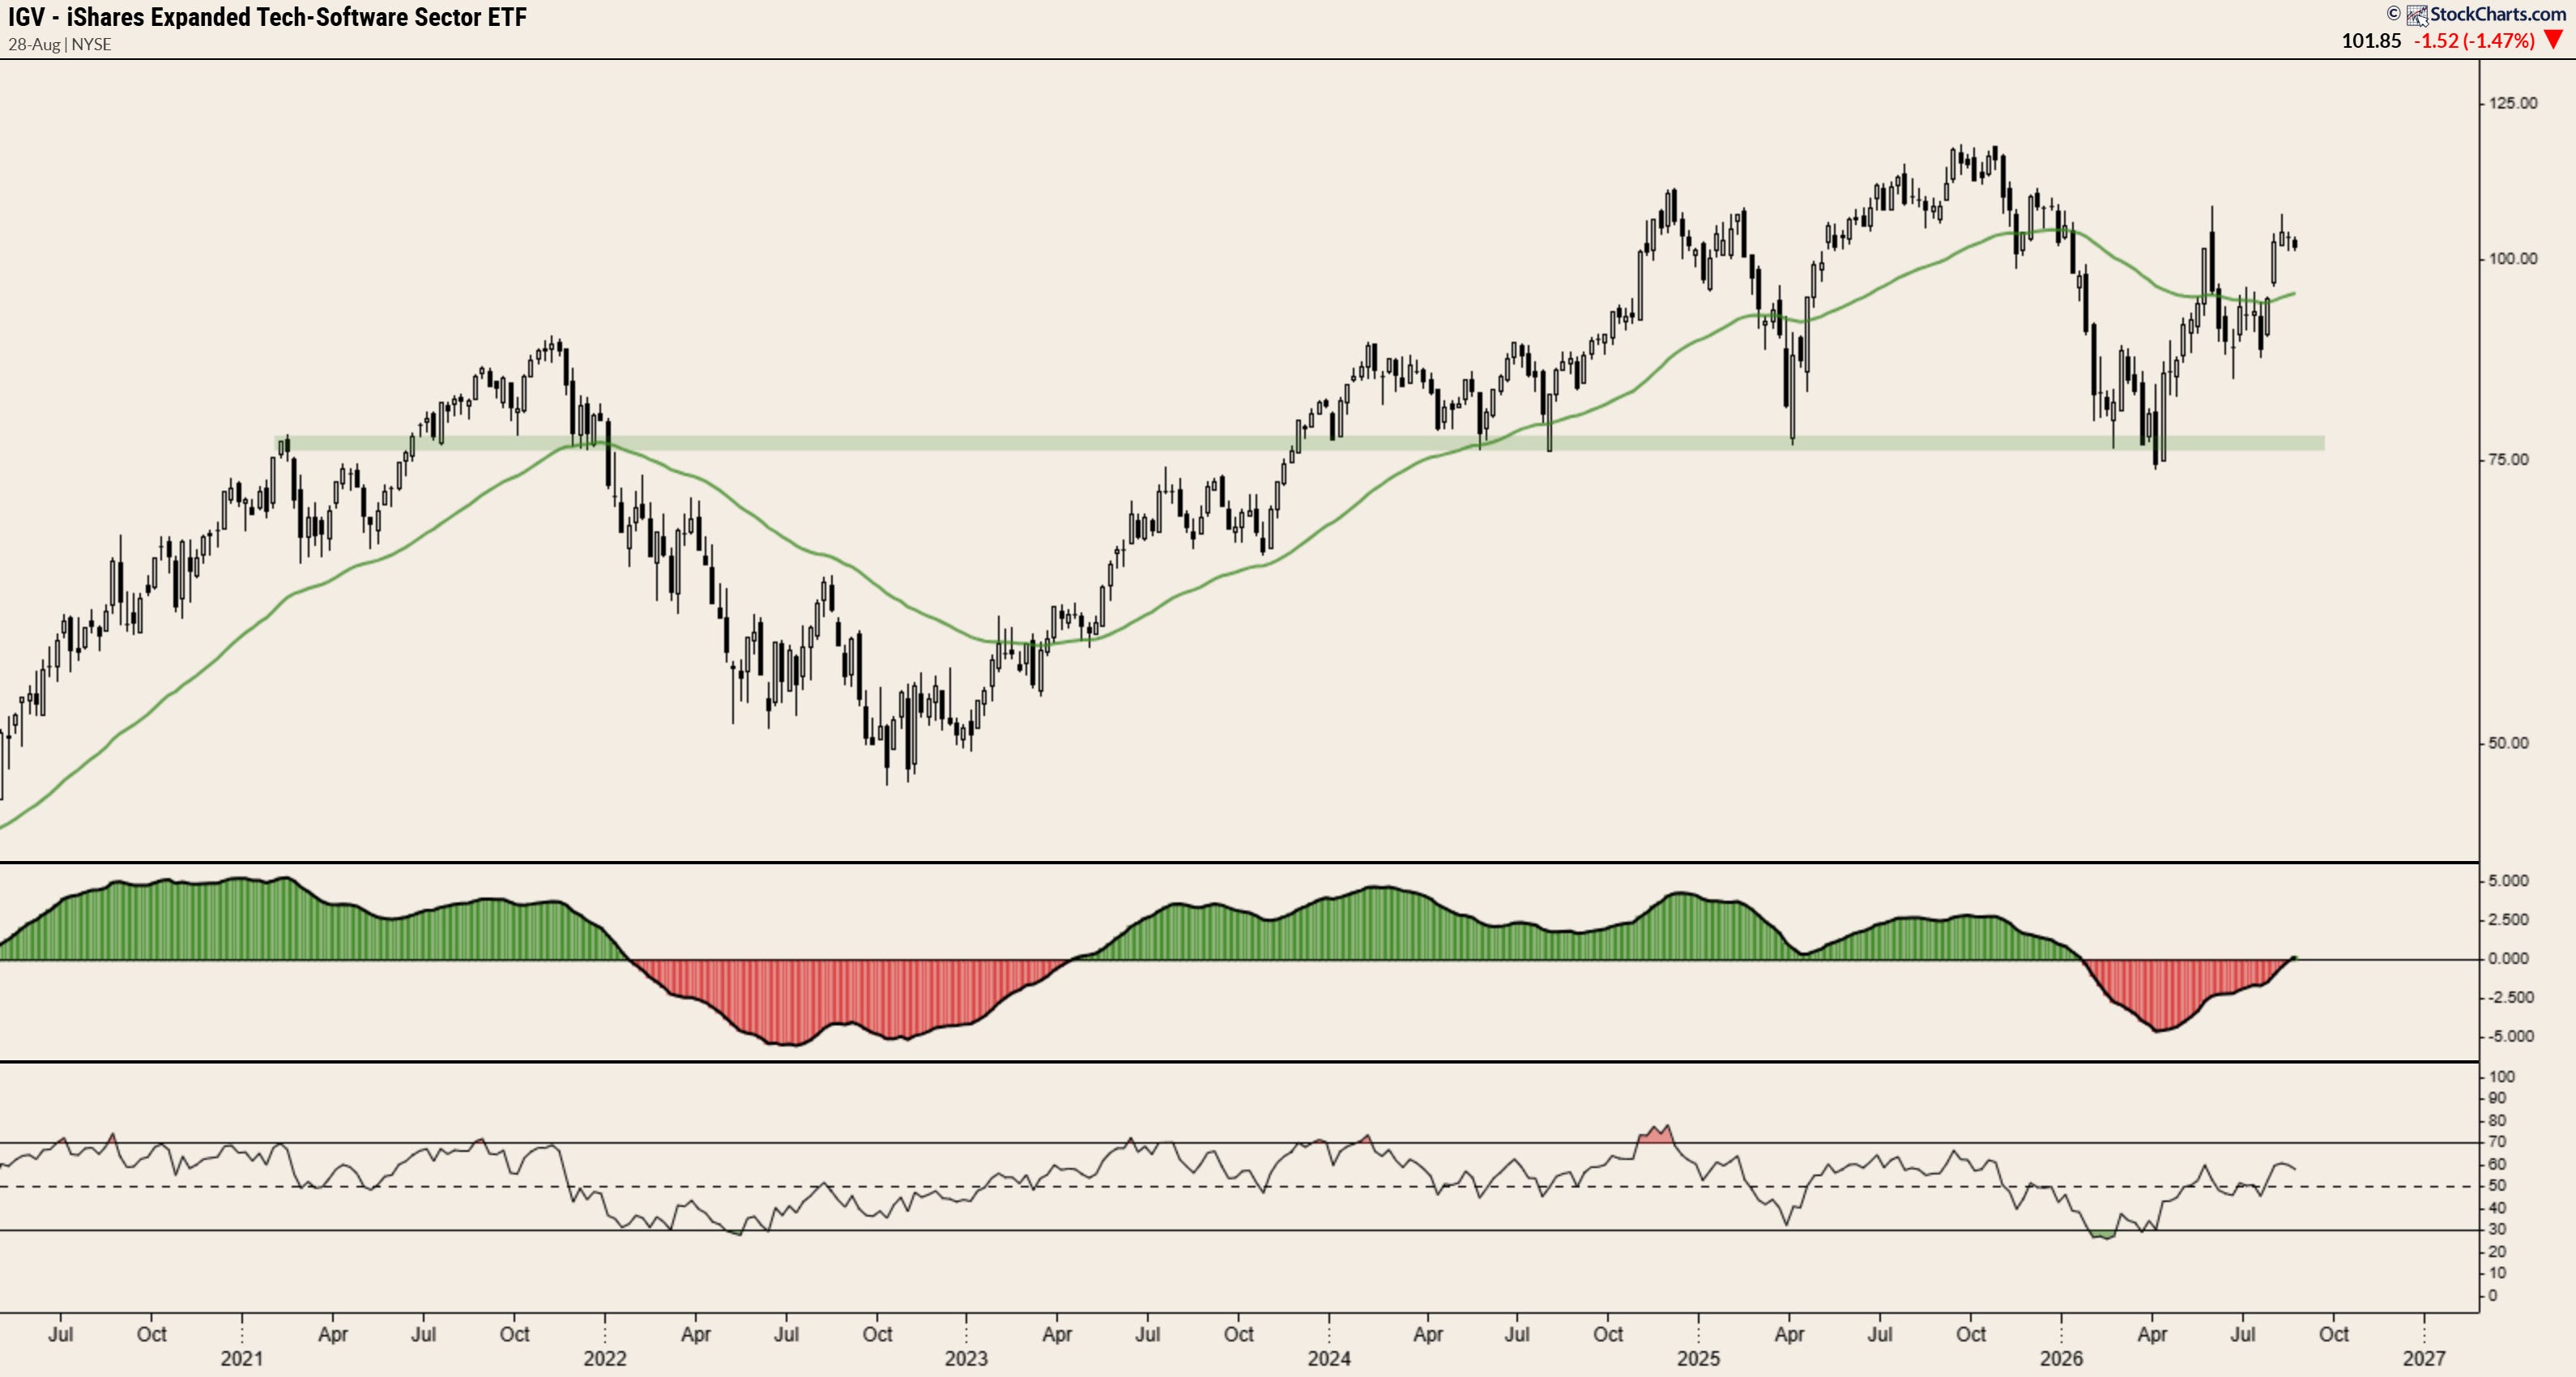
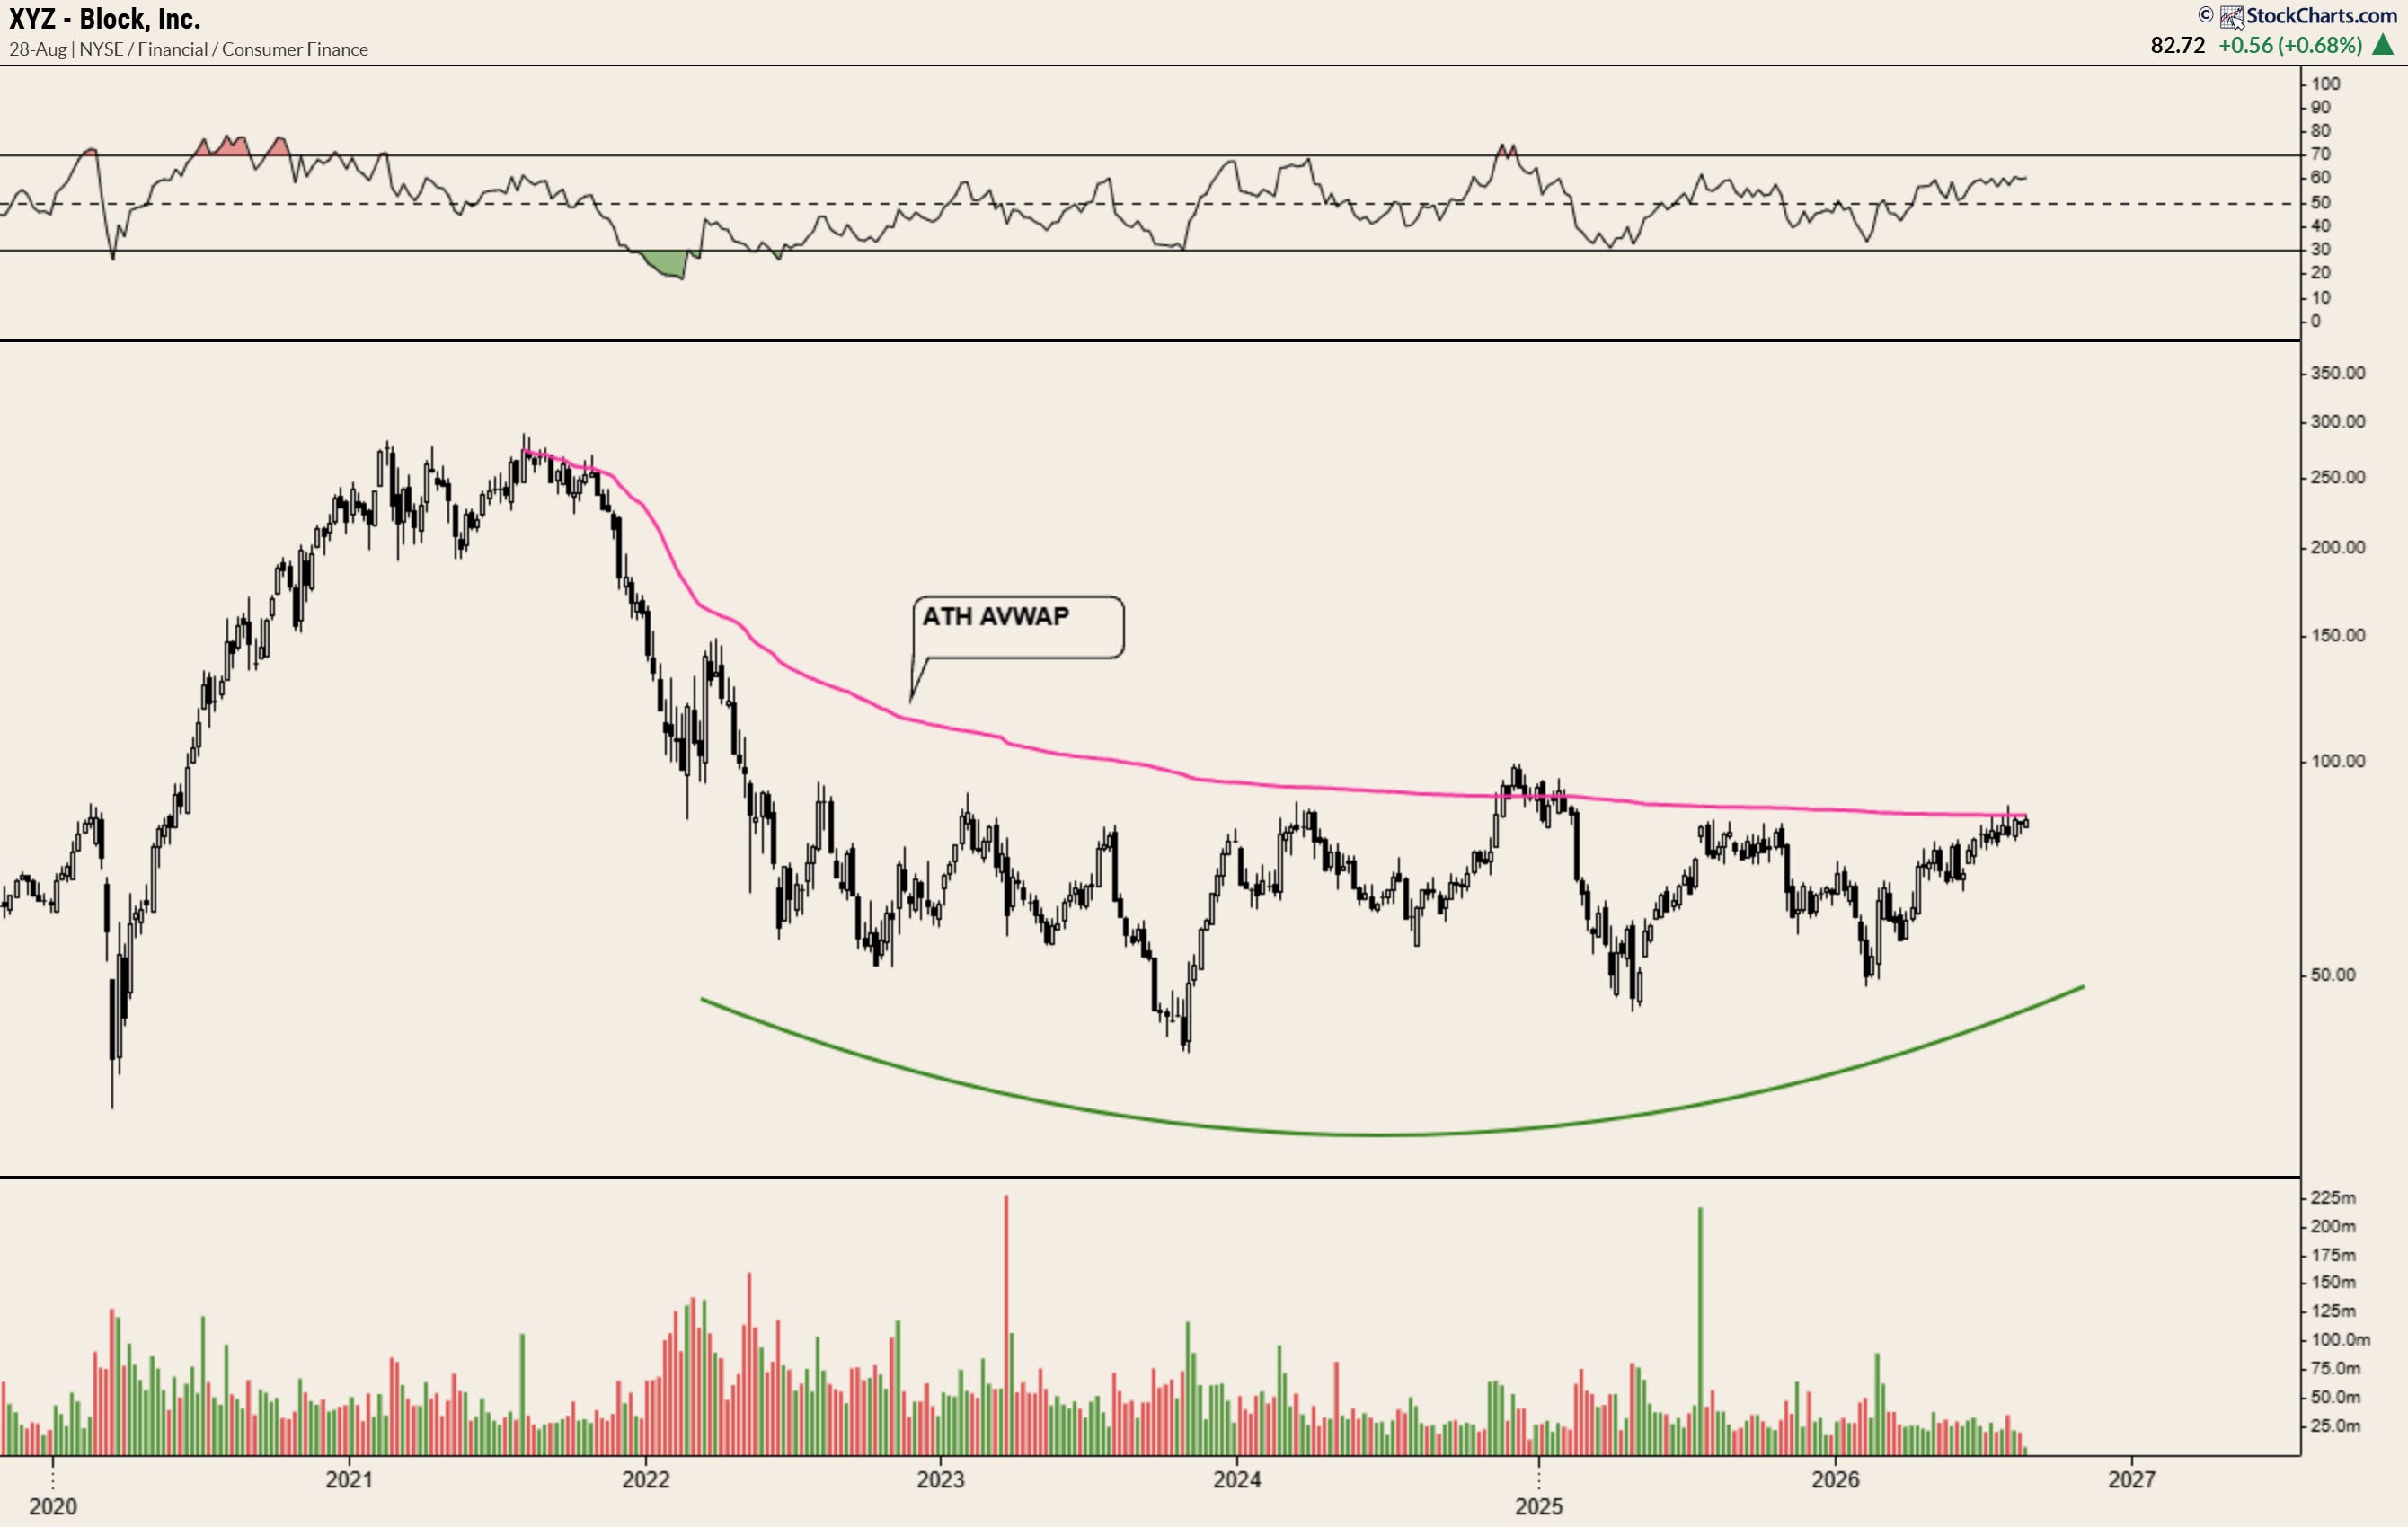
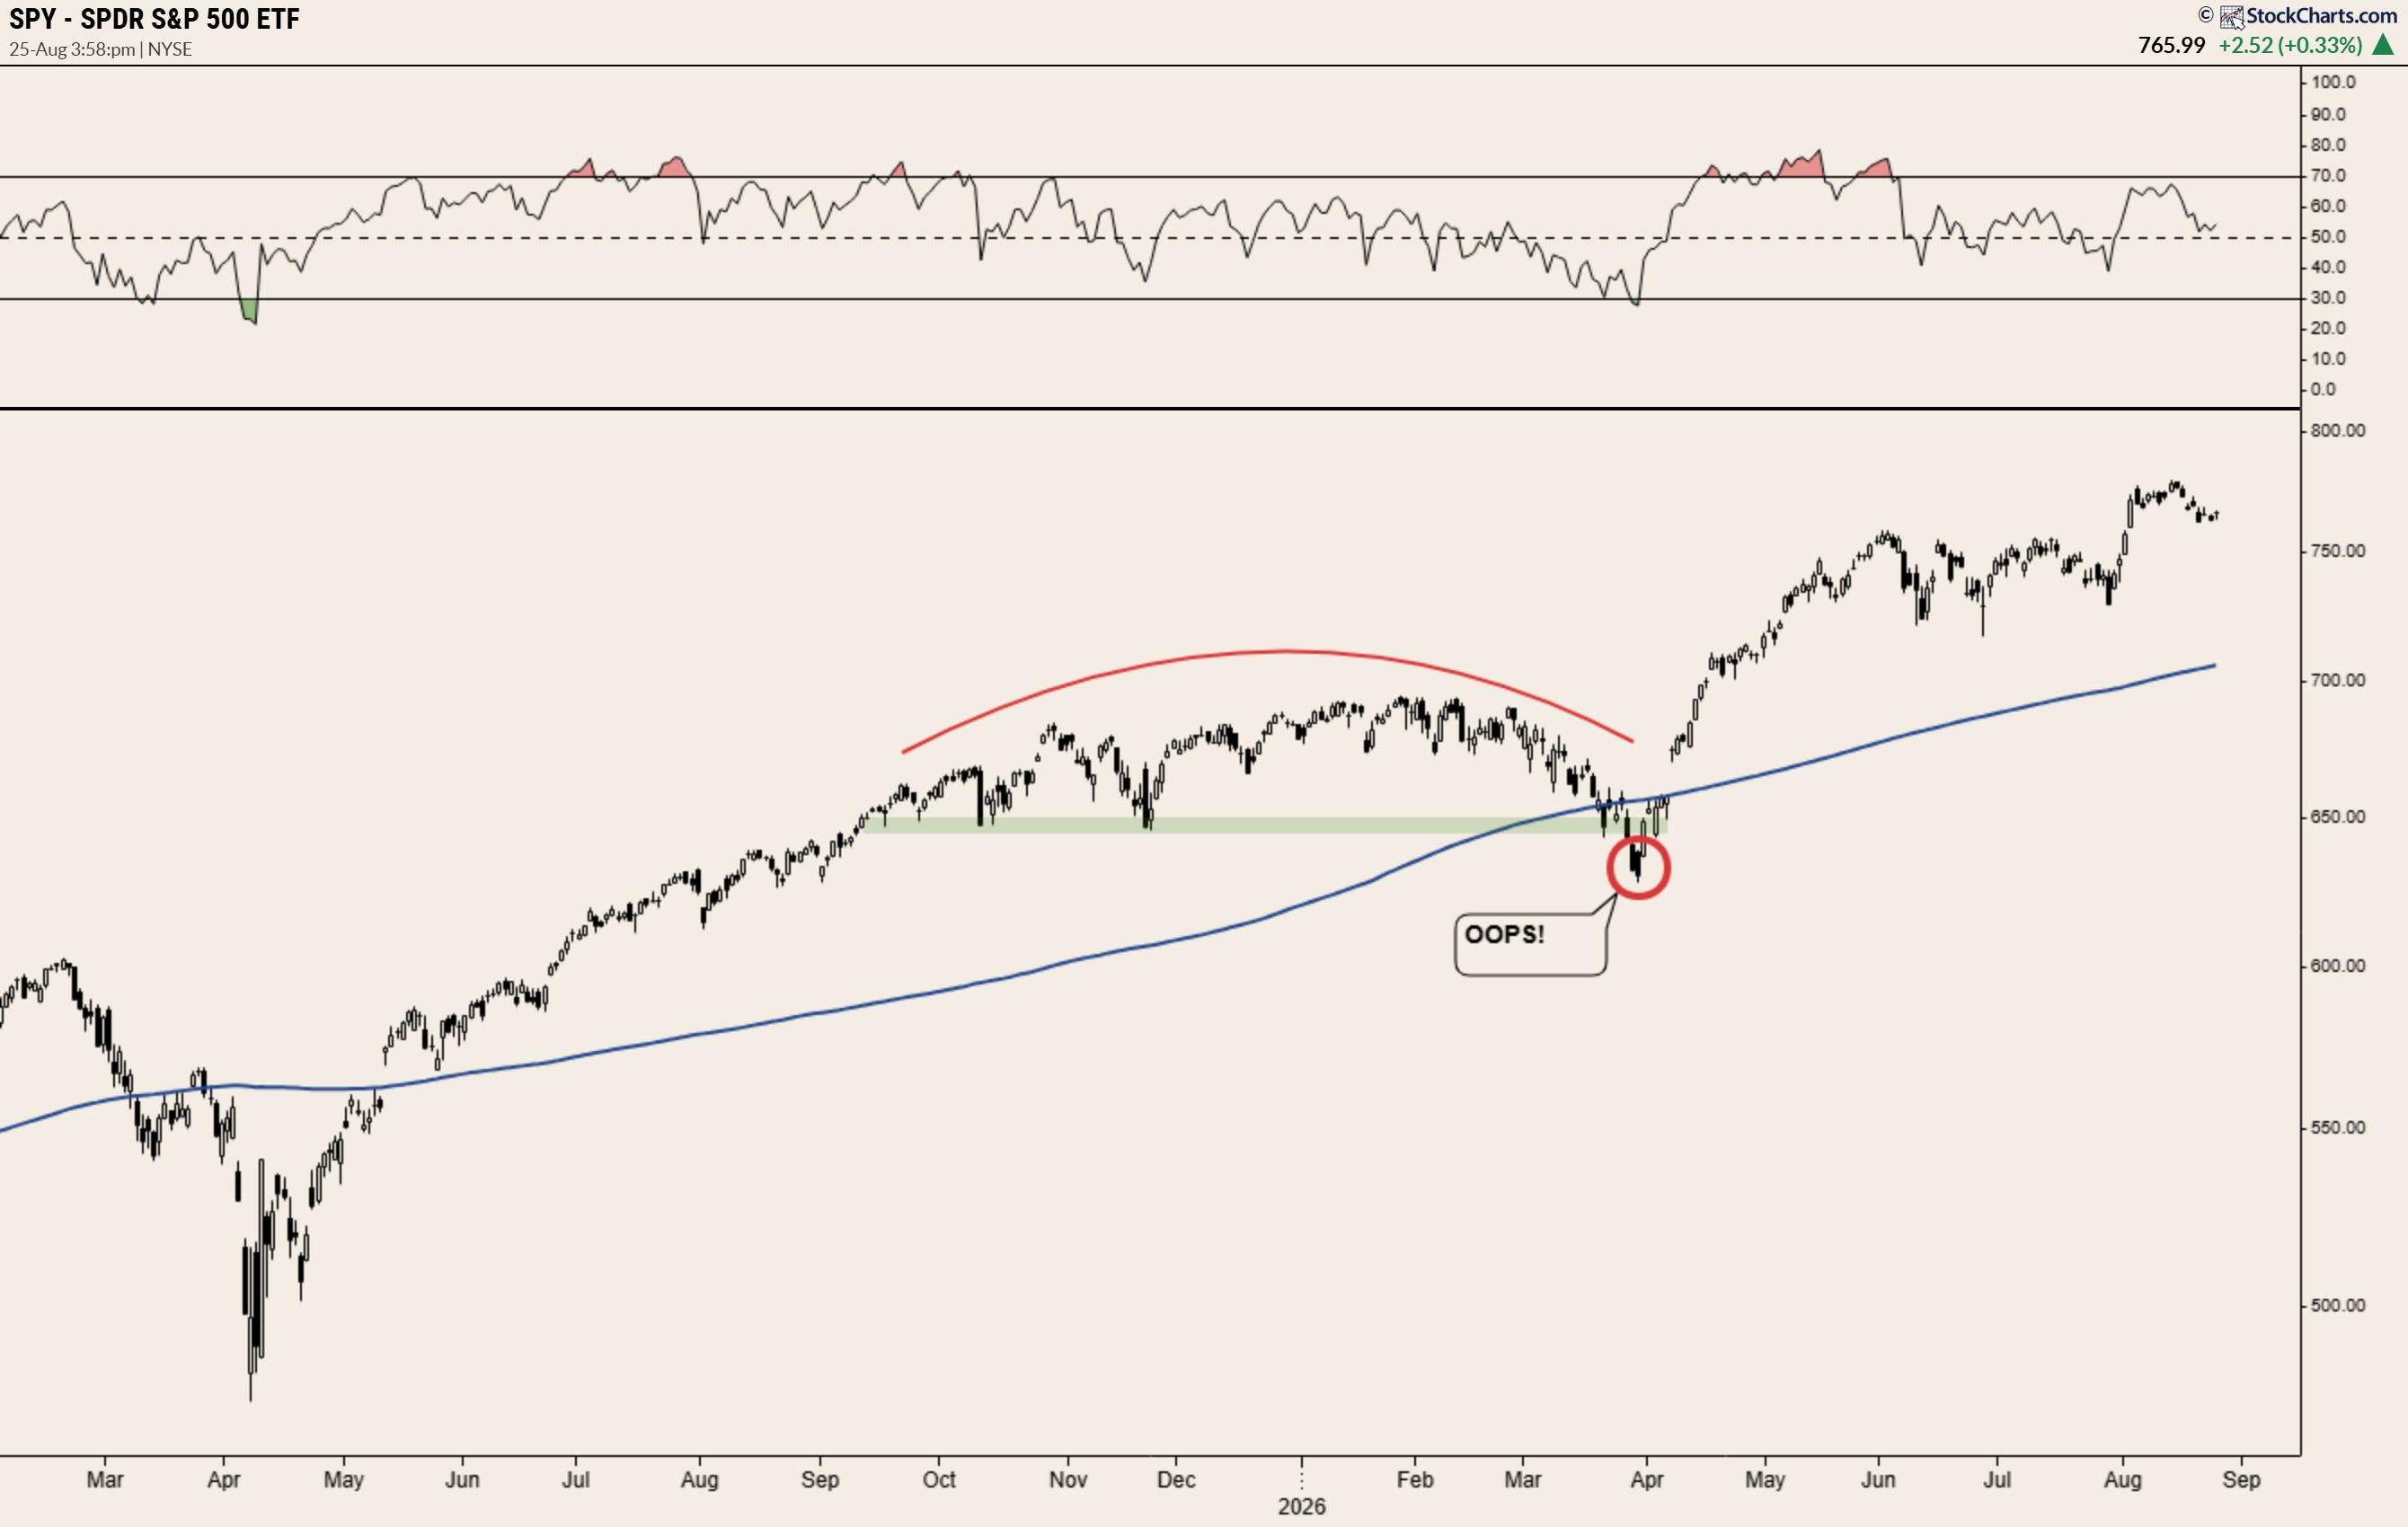
Should the above scenario play out, my belief is that - logically speaking at least - other rate-sensitive areas of the market likely follow.
This brings homebuilders, such as LGIH into focus…
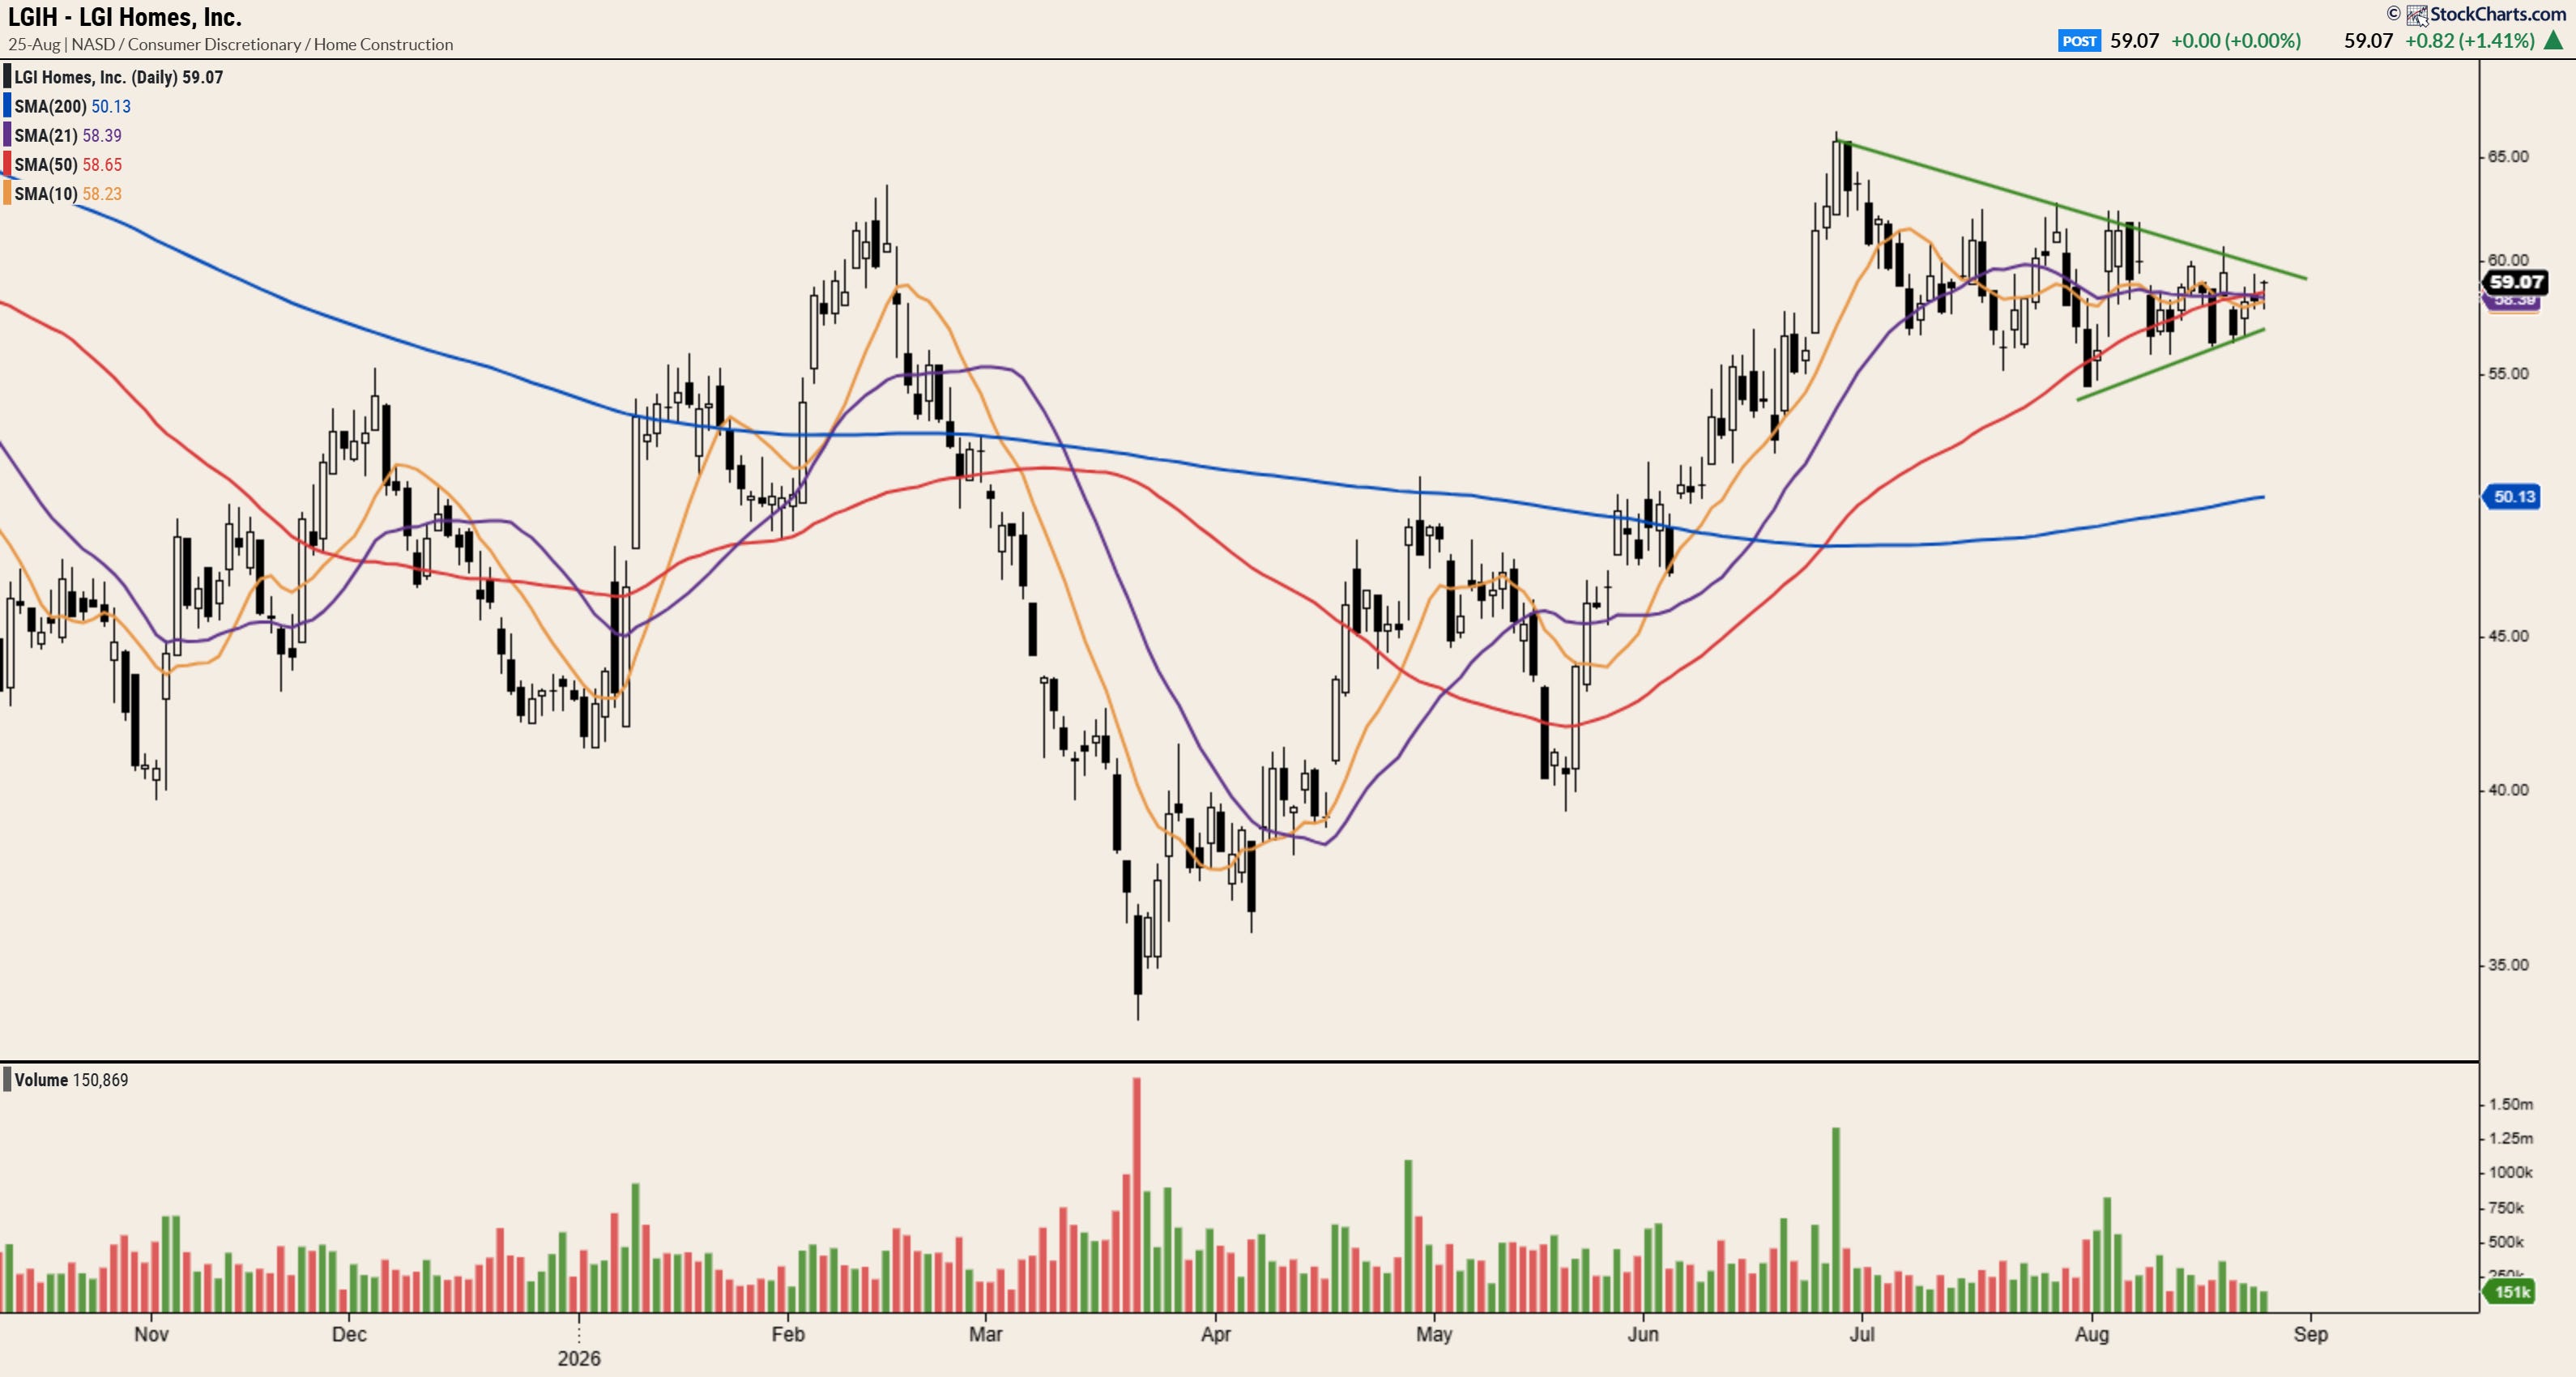
It brings Consumer Discretionary (XLY) into focus…
Software (IGV) likely holds its uptrend and flips the long term PPO bullish…
Fintech names such as XYZ potentially rip and resolve from multi-year bases…
All while the broader indices continue their relentless march higher…
But what about dem bonds?
While not my base case, we also have to consider the other side of the argument - one that narrative bros have pinned on yields, but in much simpler terms likely boils down to whether or not the charts detailed above resolve in the direction I’m anticipating.
If they don’t then we likely have a very different situation on our hands - one that delivers the much-cited seasonal weakness that tends to occur around this time during midterm election cycles, but also the unfortunate reality that comes with charts such as this…
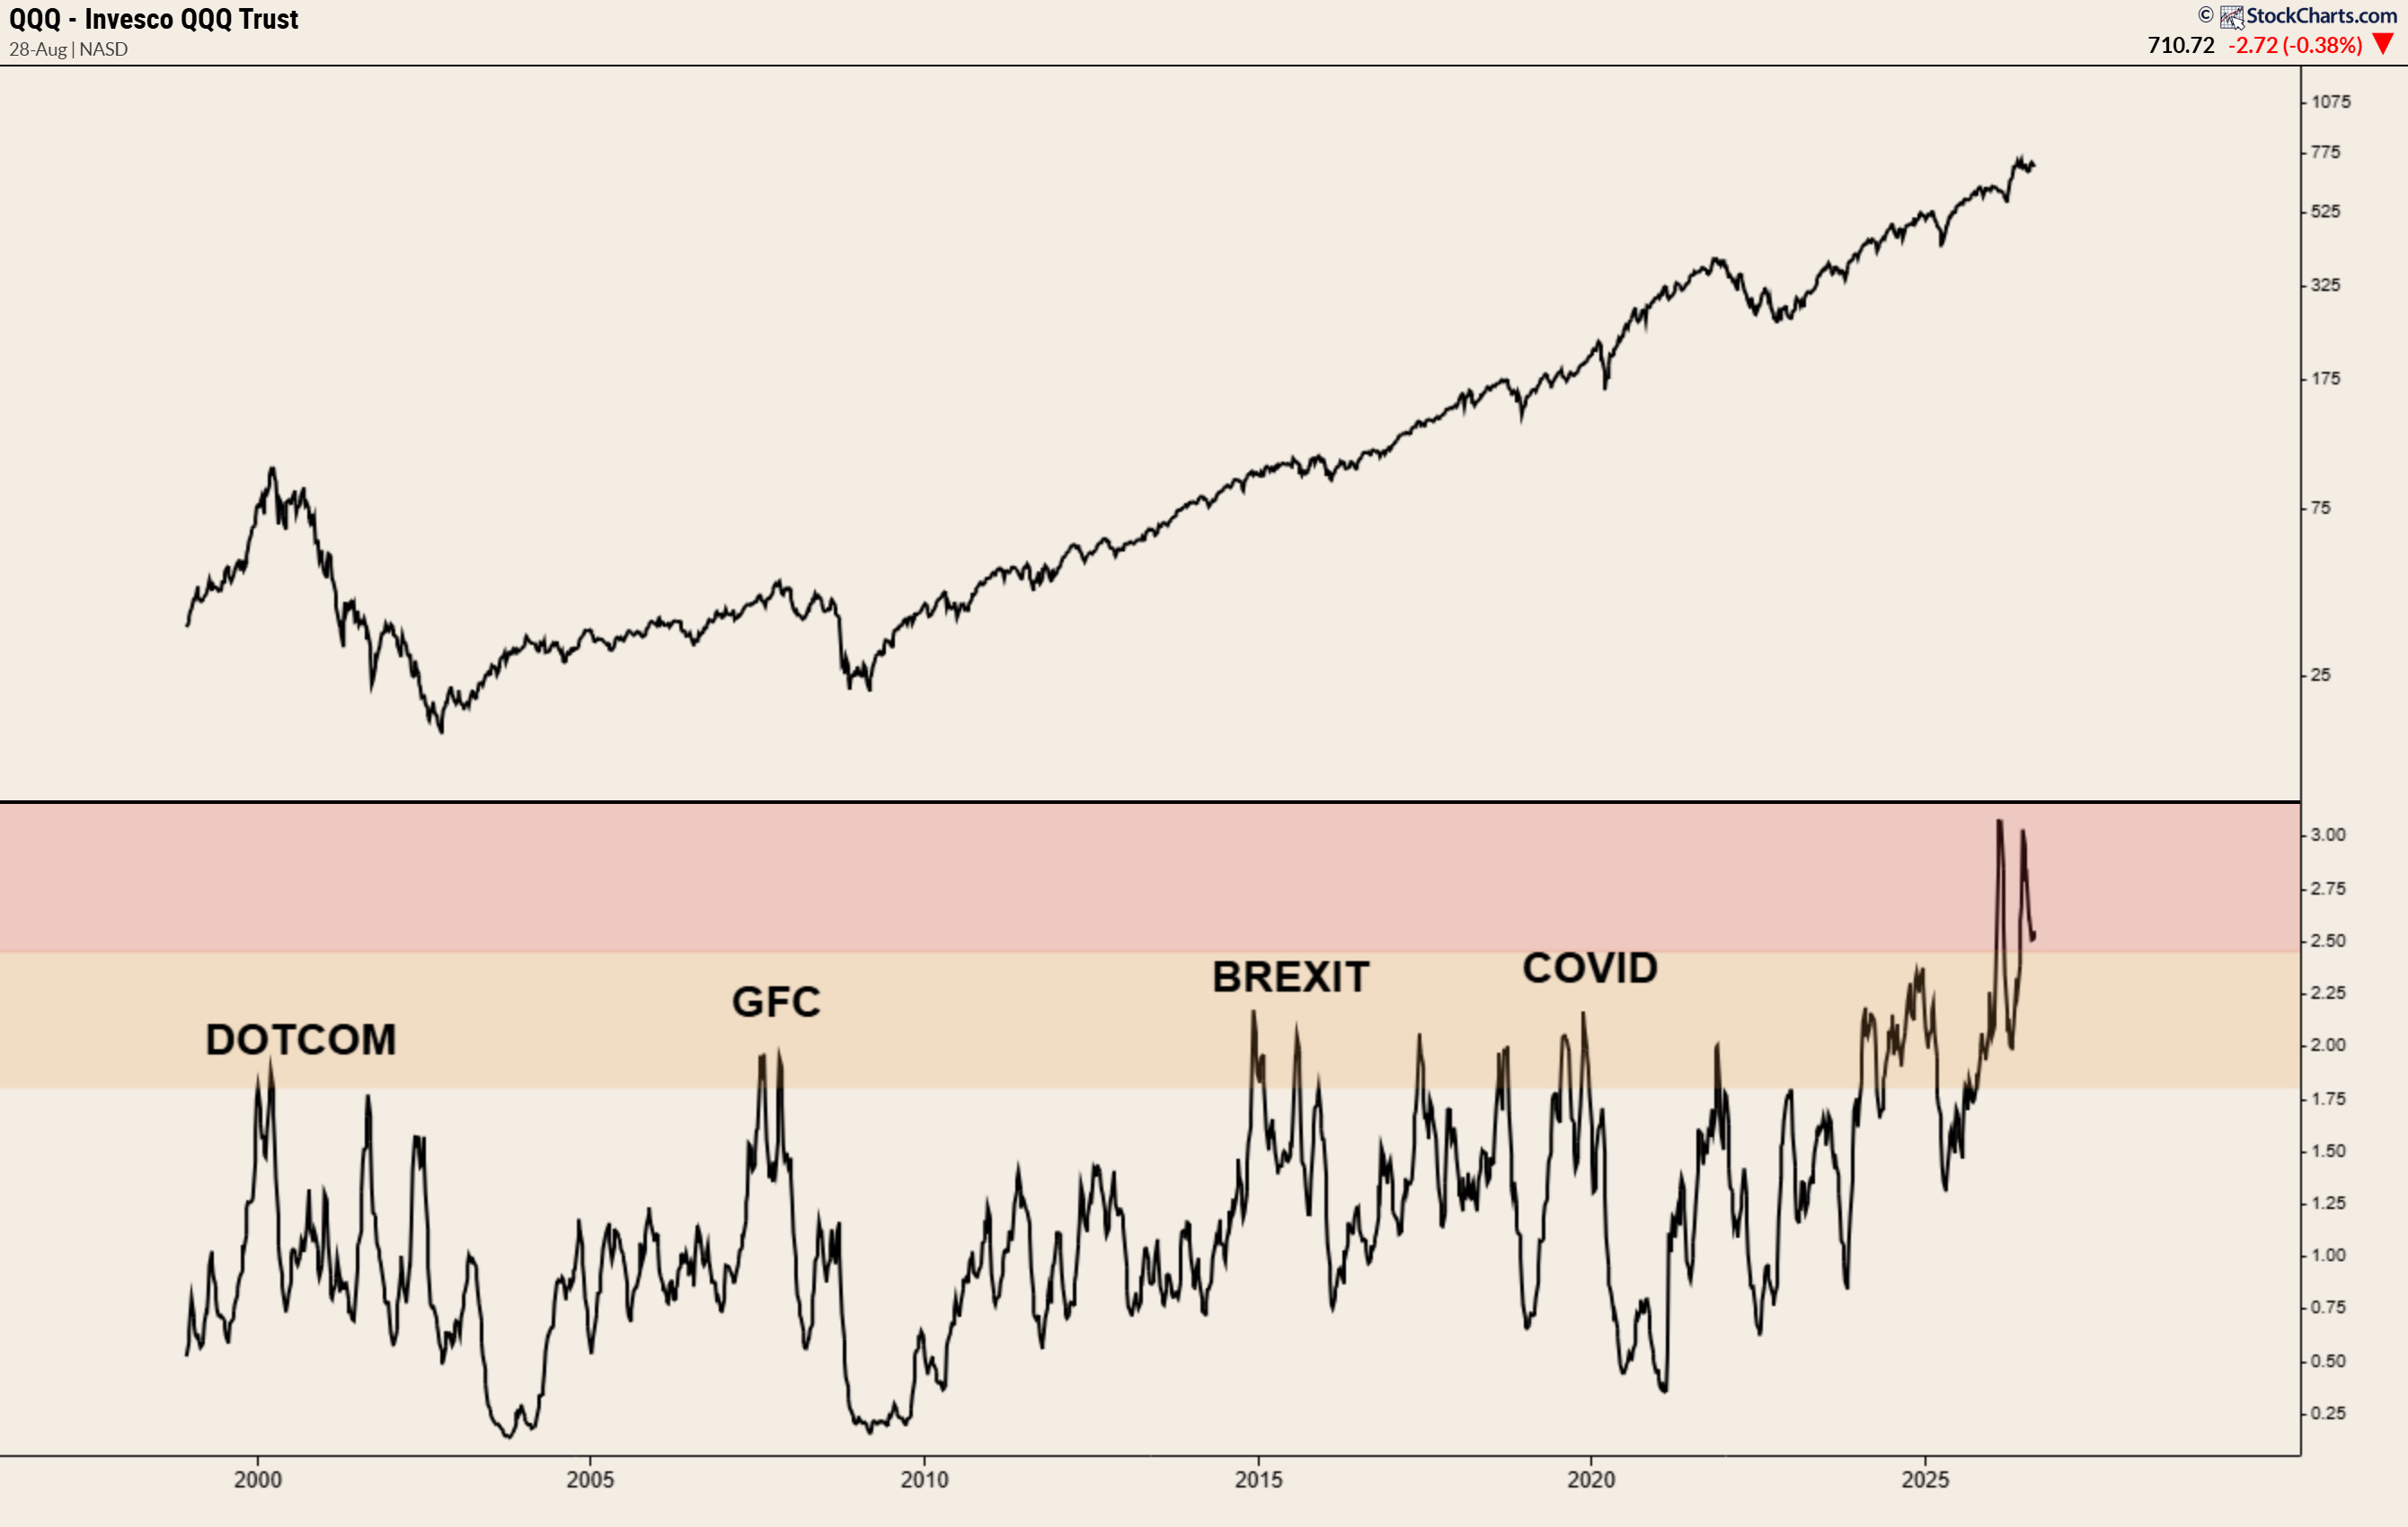
What this shows is the relationship between new 52-week highs and new 52-week lows among Nasdaq stocks. The logic is based on Norman Fosback’s High-Low Logic concept: in a healthy market, you generally shouldn’t have large numbers of stocks making both new highs and new lows at the same time.
And yet here we are…with the current reading eclipsing those which preceded the Dotcom peak, the GFC and Covid. Yikes!
Were this to undo what has been a spectacular bull market dating back to 2022, then it won’t happen in a vacuum - with an extraordinary event such as those listed in the lower panel the most plausible cause (cough, Iran, cough).
At which point we’ll likely hear about how ‘there have been ‘omens’…right’?
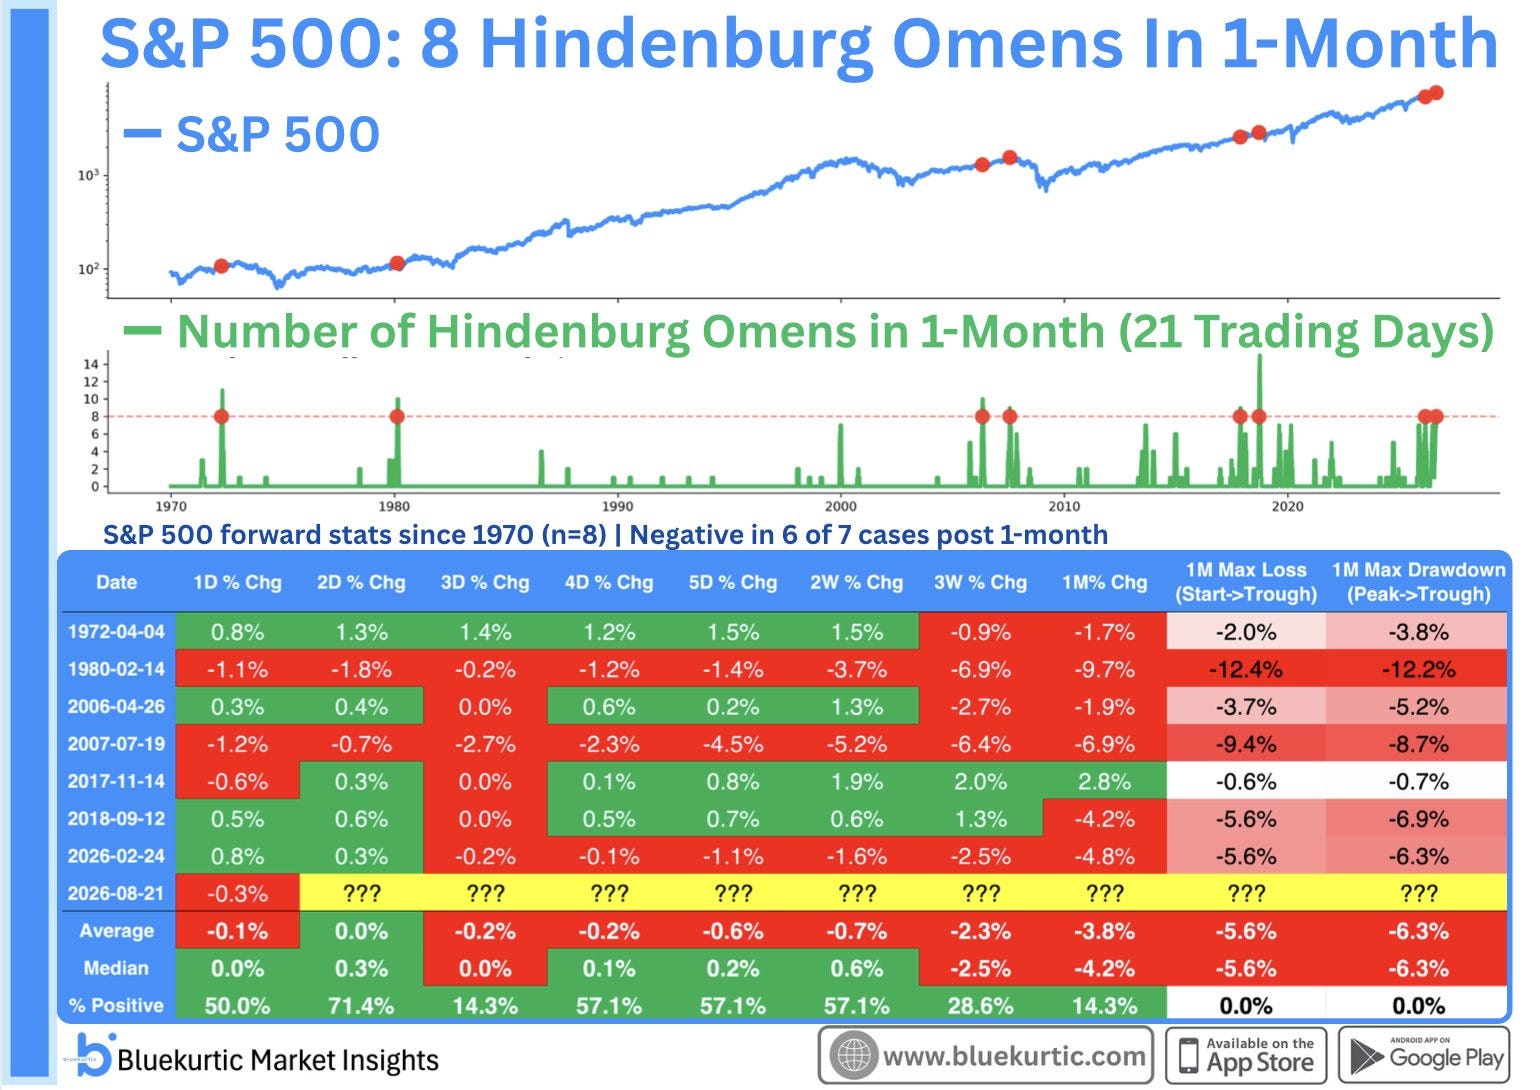
Source: Bluekurtic Market Insights
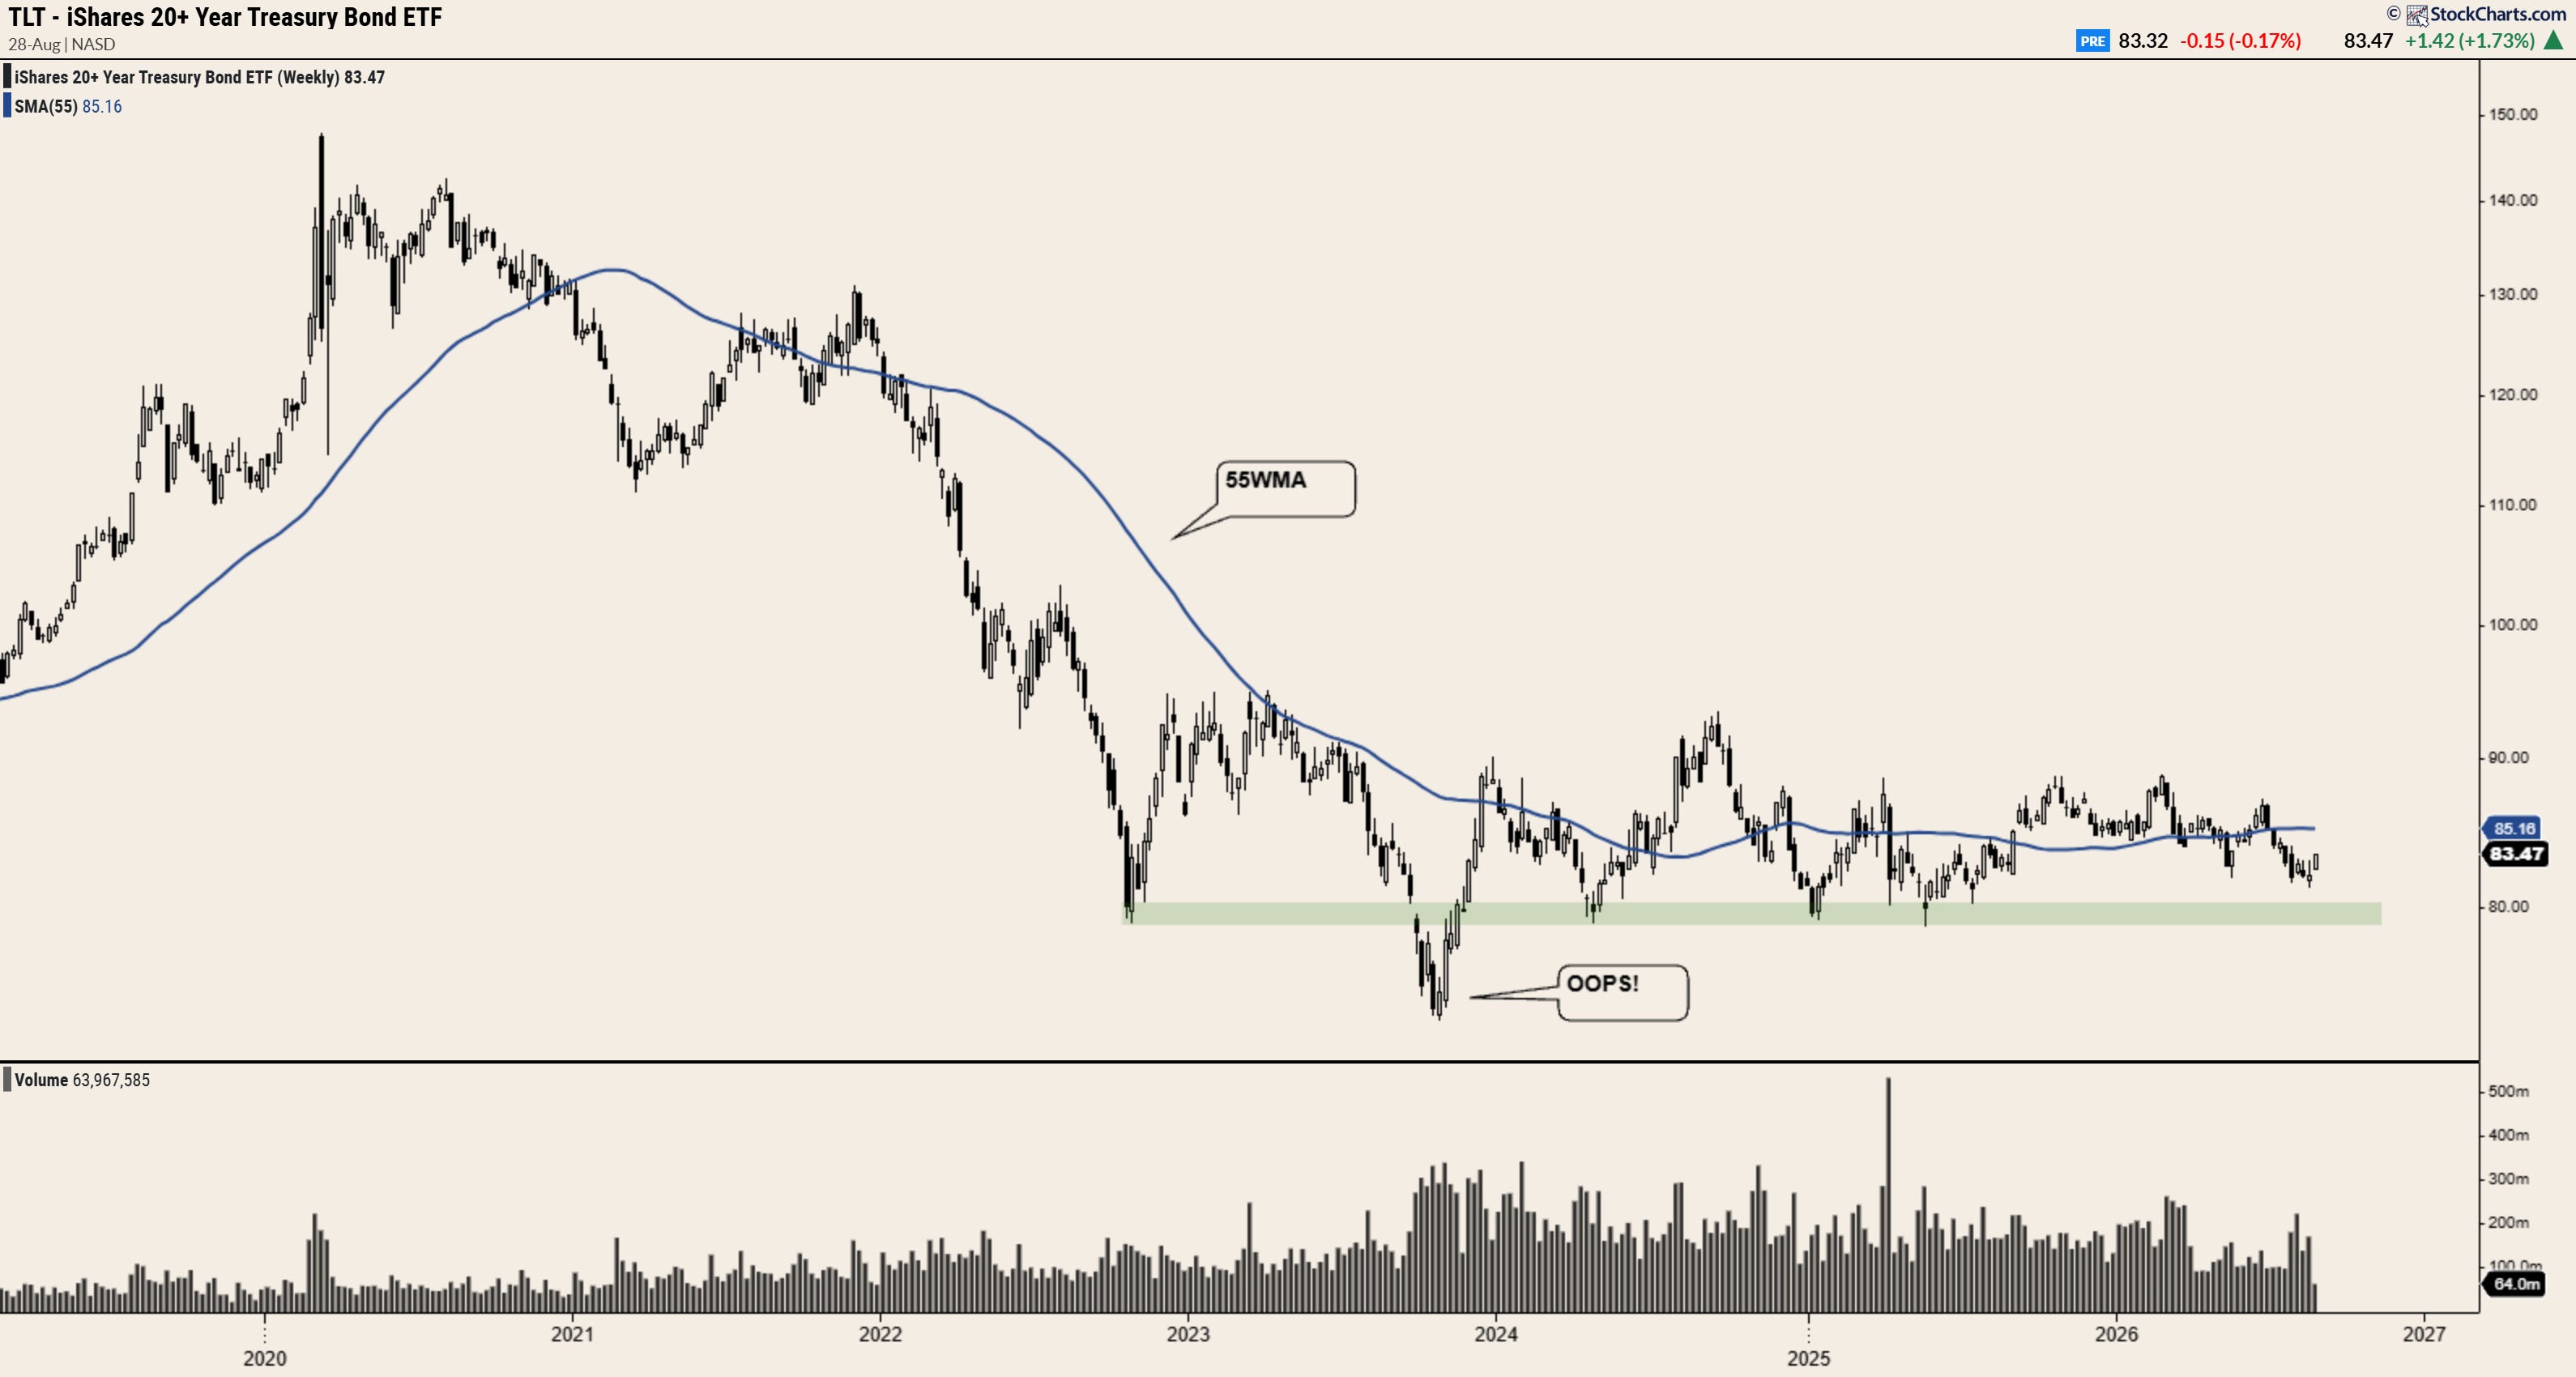
In this scenario, all the scary stuff you’ve likely been reading about oil, diesel, bonds and more comes into view - in which instance, shorting the tits out of TLT becomes the trade everyone makes…despite the fact it’s sitting at historical support and has spent the best part of four years trading in a range.
And then of course there will the shorting opportunities on SPY, QQQ and of course those tasty high-beta BTC proxy puts *looks deeply into Michael Saylor’s eyes*. Yummy.
If I sound facetious…
While it’s important to acknowledge the left-tail risk that comes with this latter scenario, I want to make it clear that my base case remains firmly in the bull camp.
And no, that’s not just a gut feeling…
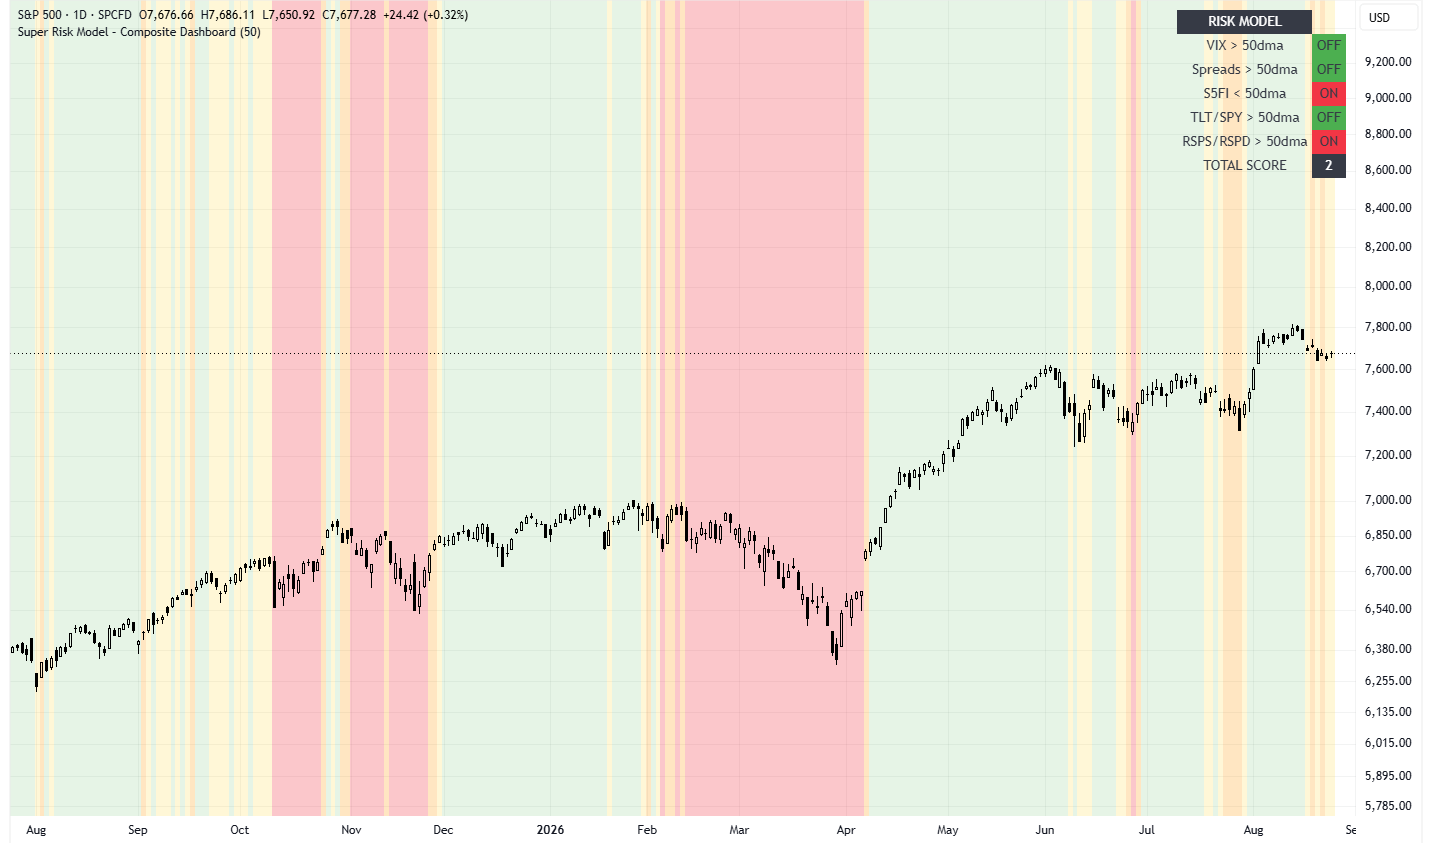
Looking at my risk composite model, sure - there are signs of moderate weakness present in the market.
Medium-term breadth metrics (stocks above the 50dma) have deteriorated slightly, whilst staples relative to discretionary remains above its non-trending 50dma.
But are either of these enough to get my bear juices flowing? Come on, man.
Until we see volatility expand, spreads widen and, above all else, price begin to fall - I’m comfortable entering some starter positions across some of the market’s more rate-sensitive names.
Should these break below upwardly mobile moving averages or prior support zones, then sure - I’ll take the L and reassess. That’s trading.
But if I’m right? Well then we’ve got a different situation on our hands entirely - one that sees high beta continuing its relentless march to the right, crypto maintaining its monster move from the lows and SPY continuing its surge towards $8k. Woof woof.
And in this scenario, you bet I’ll be putting some capital to work.
Best,
Alex
Disclaimer
The information contained in this article is provided for educational and informational purposes only and reflects my personal opinions at the time of writing. Nothing here should be interpreted as financial advice, a recommendation to buy or sell any security, or a guarantee of future performance.
As always, do your own research, consider your own financial circumstances, and never invest money you cannot afford to lose. I may hold positions in securities mentioned throughout this article, and those positions may change without notice.