



As the market continues to frustrate bulls and bears in equal measure in what has proven to be a tricky tape since new highs were made back in June, I have found myself somewhat gun shy of late.
Whereas in Q2 short term swings felt almost too easy, Mr. Market has wasted no time in teaching me a valuable lesson over the last month or so - one of patience, at least until we see a definitive break in either direction across neatly coiled indices.
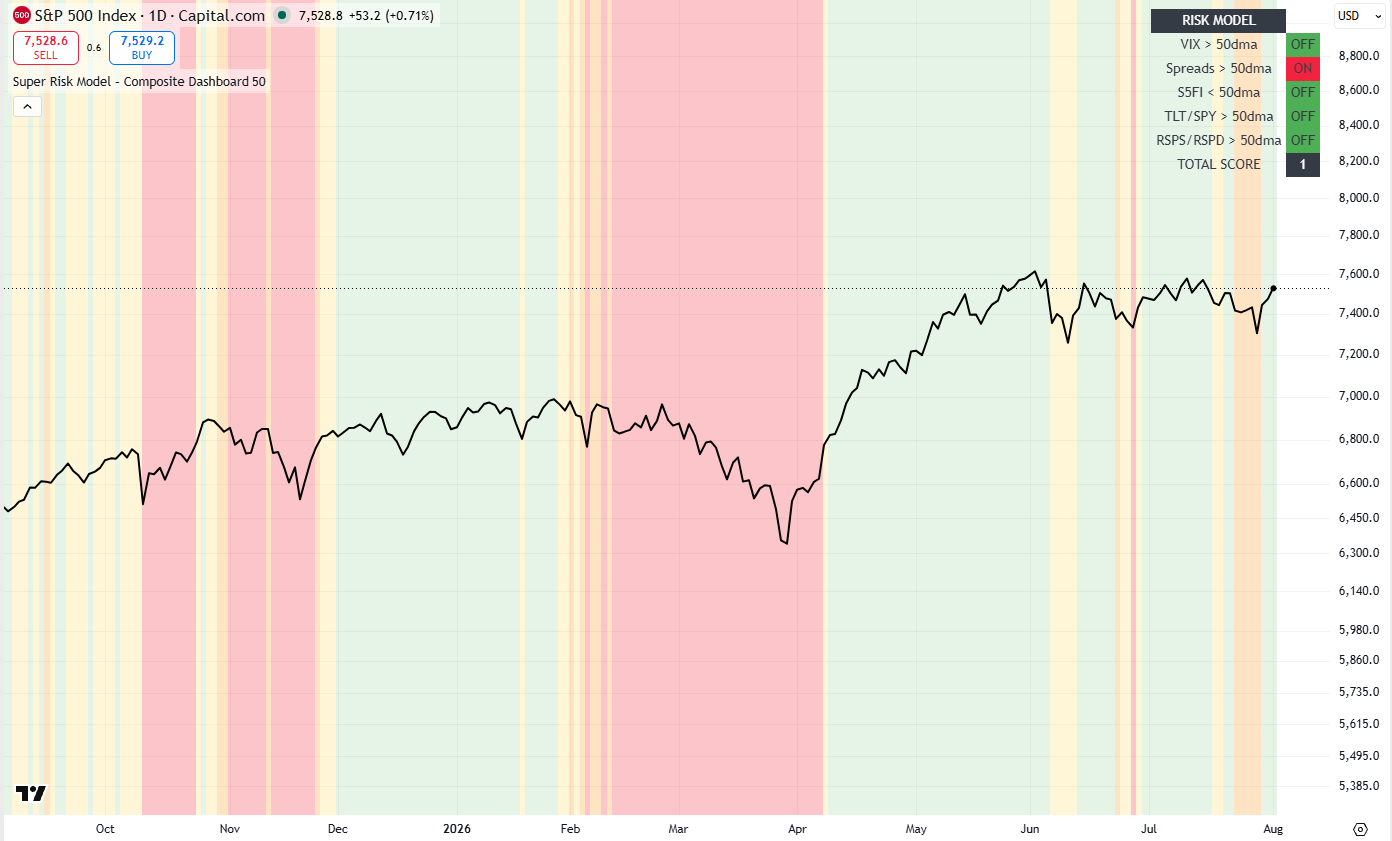
On the surface, things appear calm - demonstrated by my Risk Composite Model (below) that shows only one trigger firing at the time of writing:
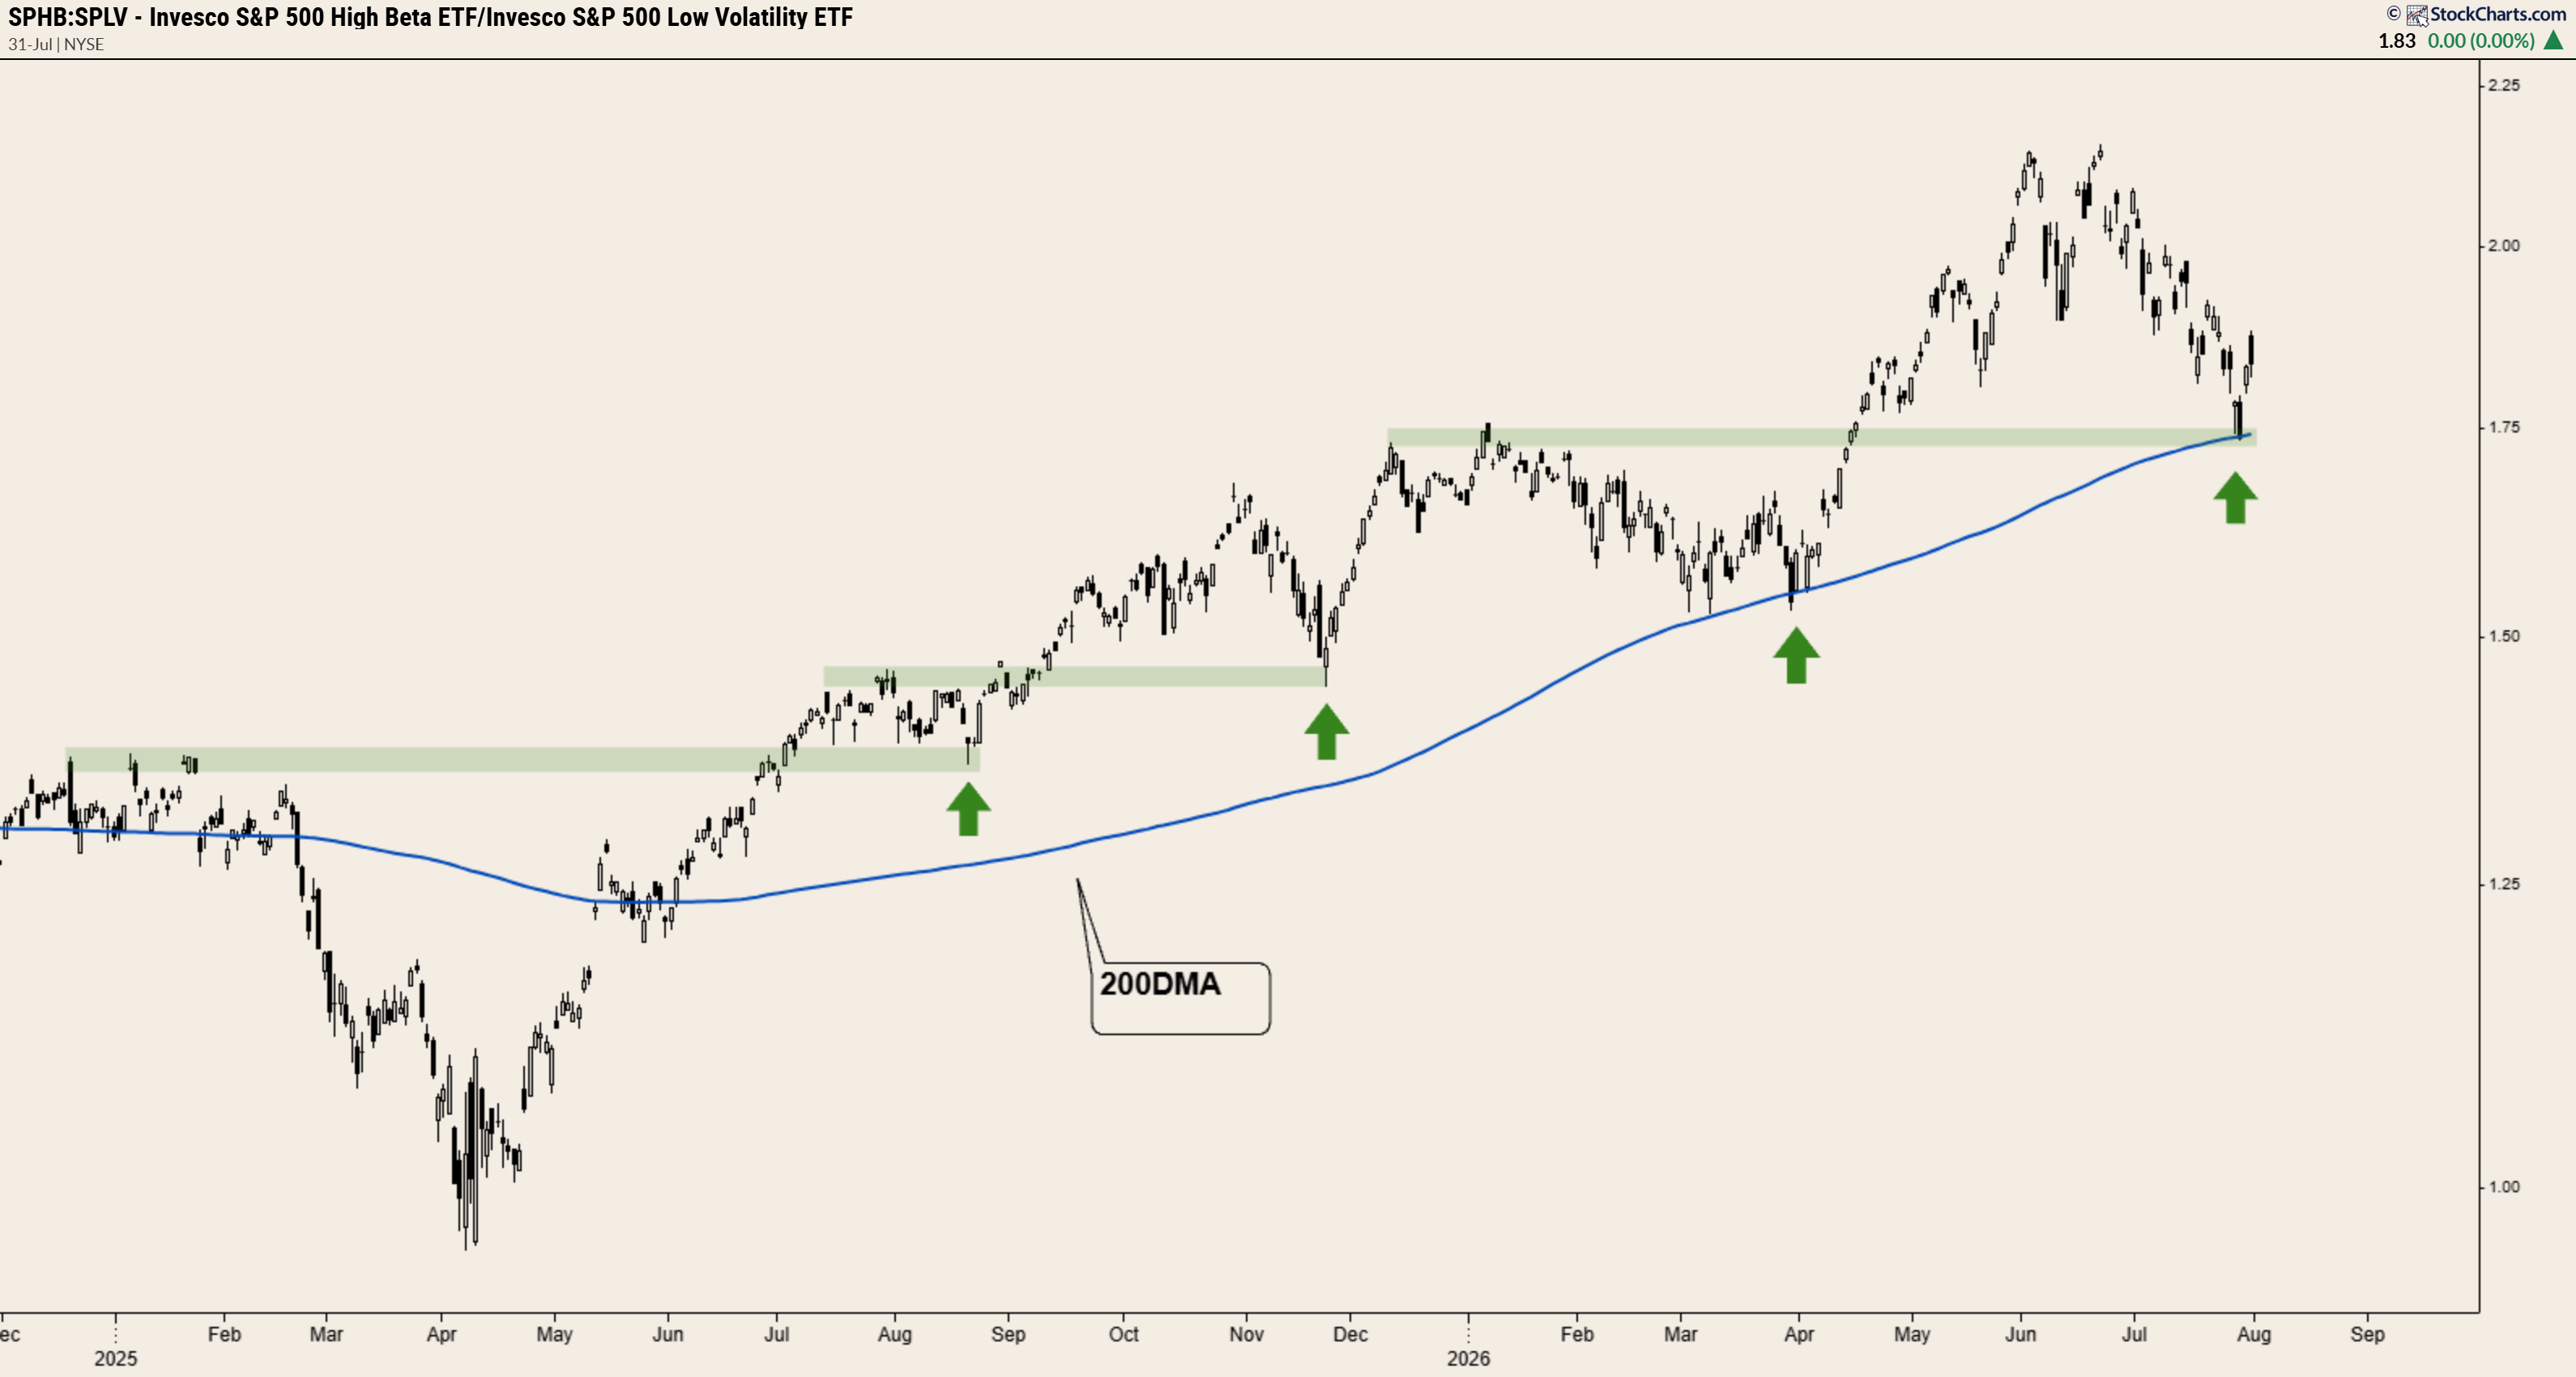
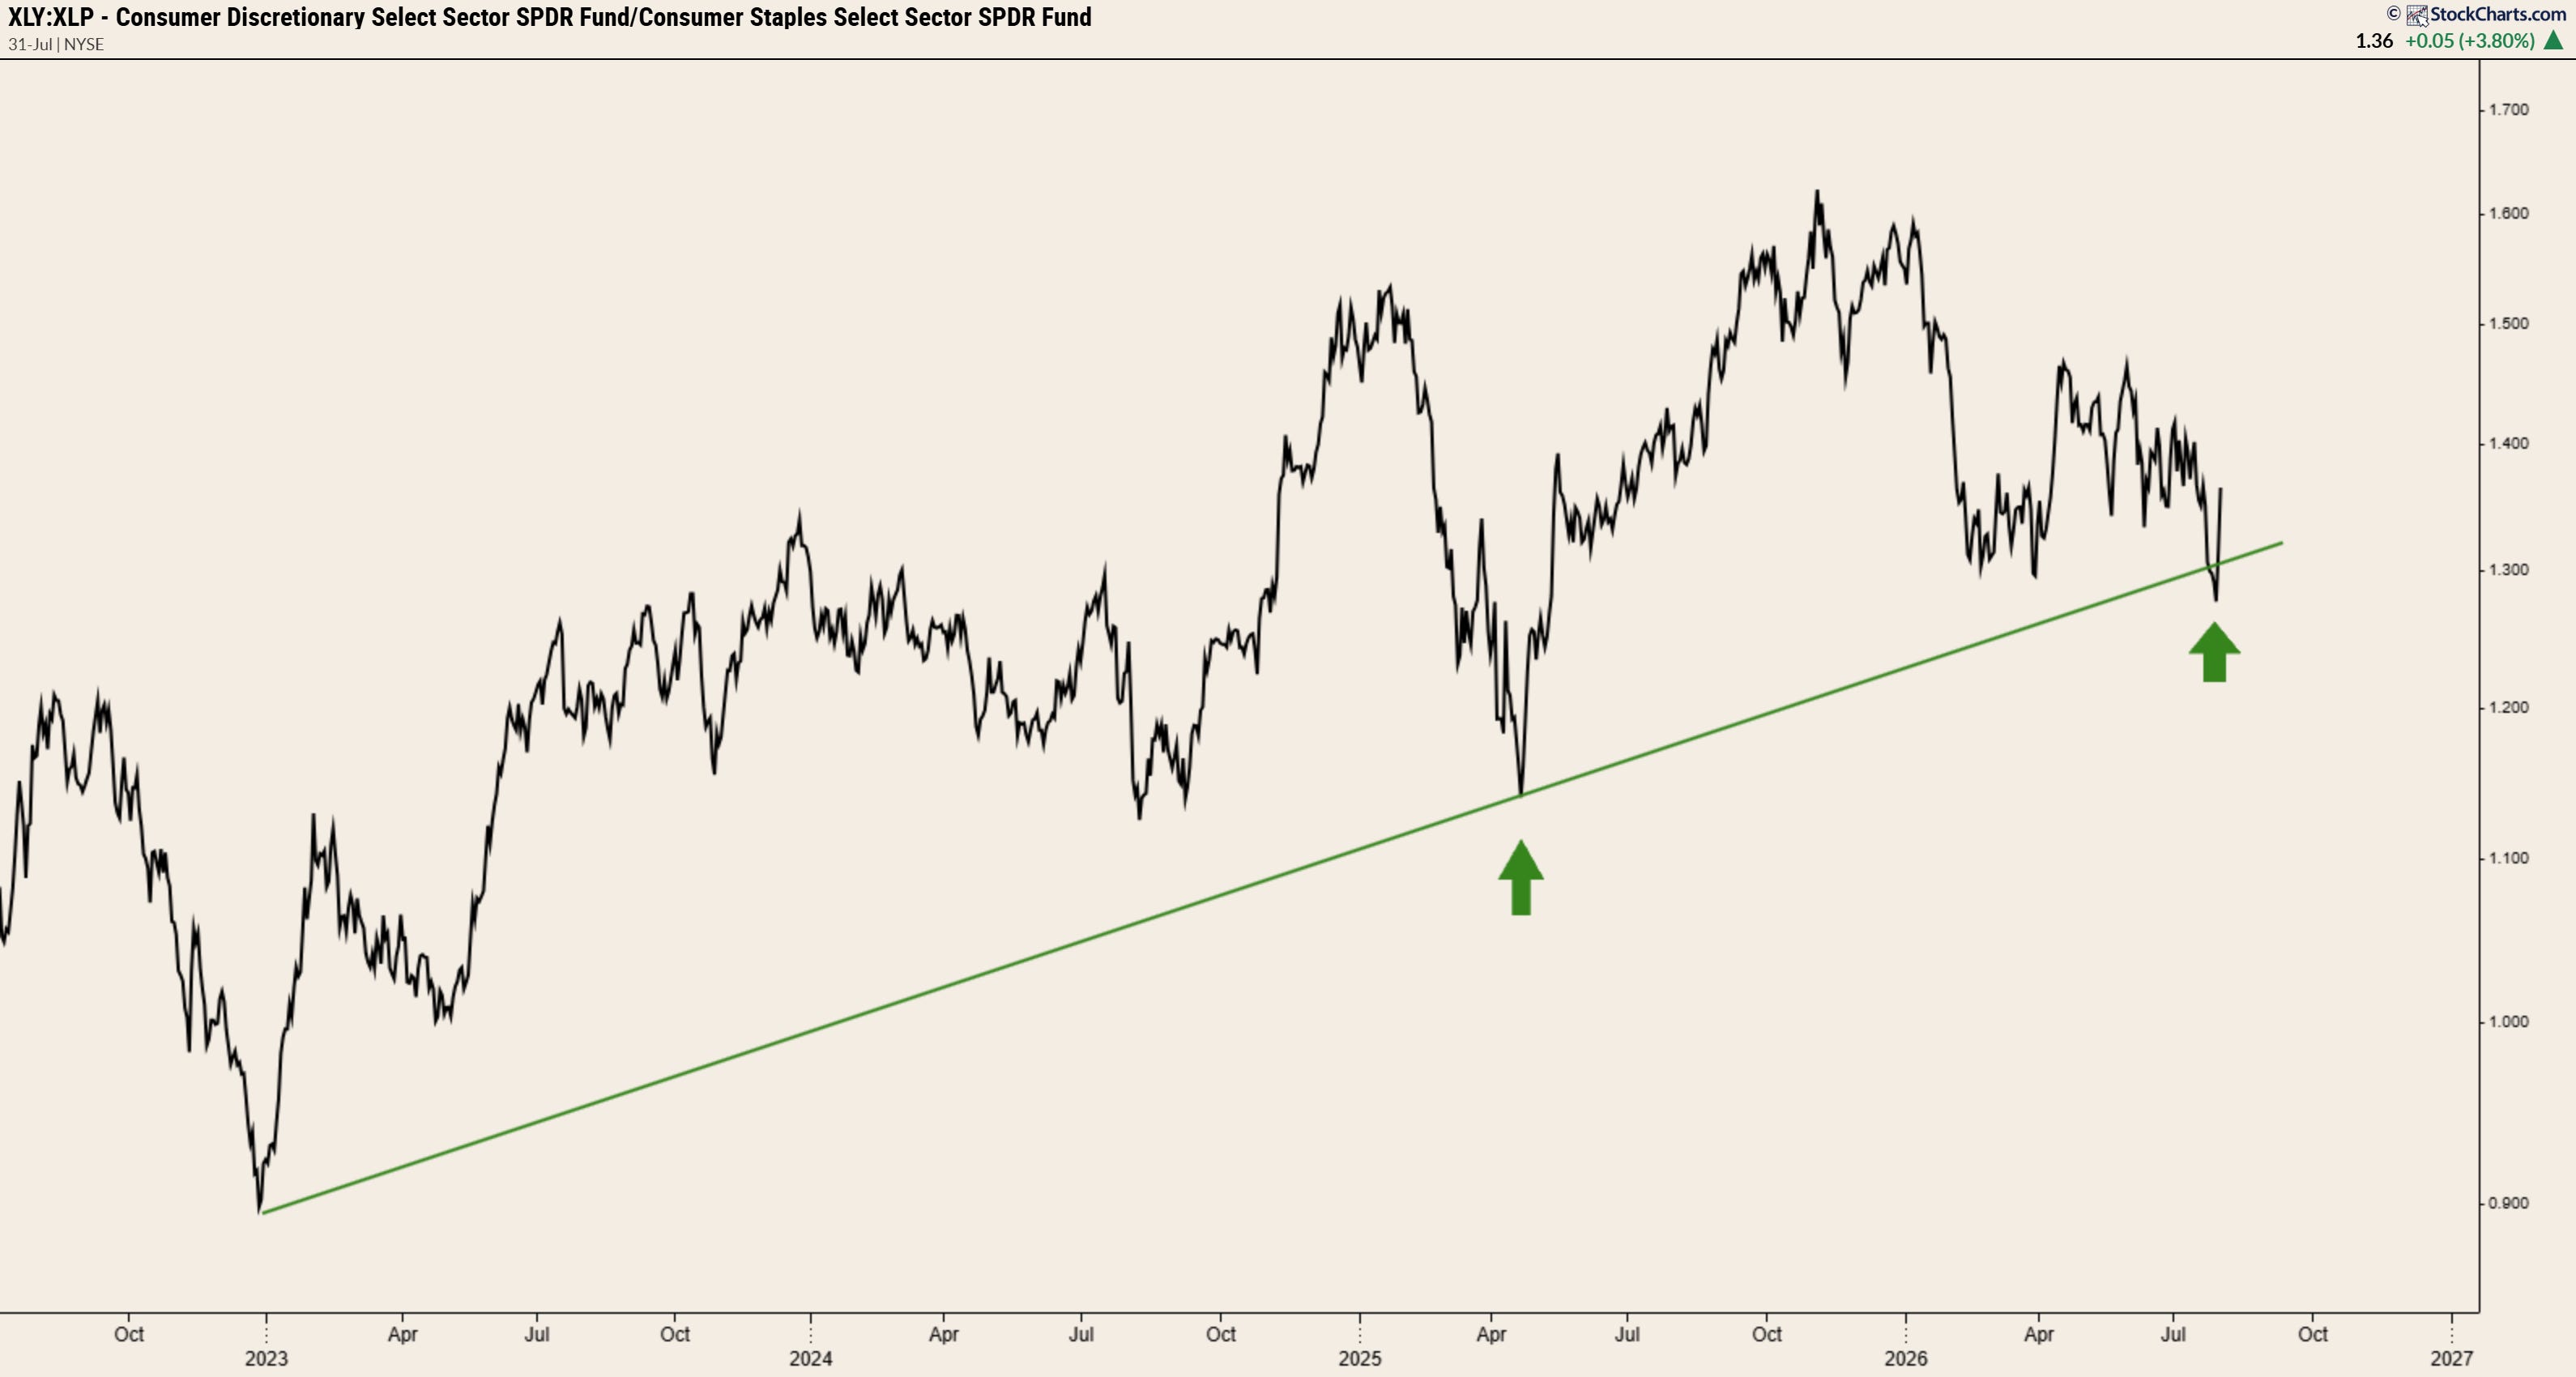
Elsewhere, a number of key risk on/risk off measures continue to hold exactly where bulls needed them to - with the best two examples arriving in the form of SPHB/SPLV and XLY/XLP.
And that’s without mentioning SPY, QQQ and IWM - all of which remain above an upwardly mobile 200dma, despite recent consolidations.
So Why Aren’t I Buying?
If you were to look at these charts in isolation, you might be wondering why I haven’t piled in to the same high beta longs that have contributed so handsomely to the bull market that’s been in play since late 2022.
Believe me, it’s something I’ve been thinking about a ton myself.
But markets don’t function in a vacuum. Instead, they are the sum of countless moving parts- leadership, breadth, sector rotation, macroeconomic forces, interest rates and investor positioning- all pushing and pulling against one another.
And right now, while pockets of the market continue to look constructive, plenty of other signals are flashing amber.
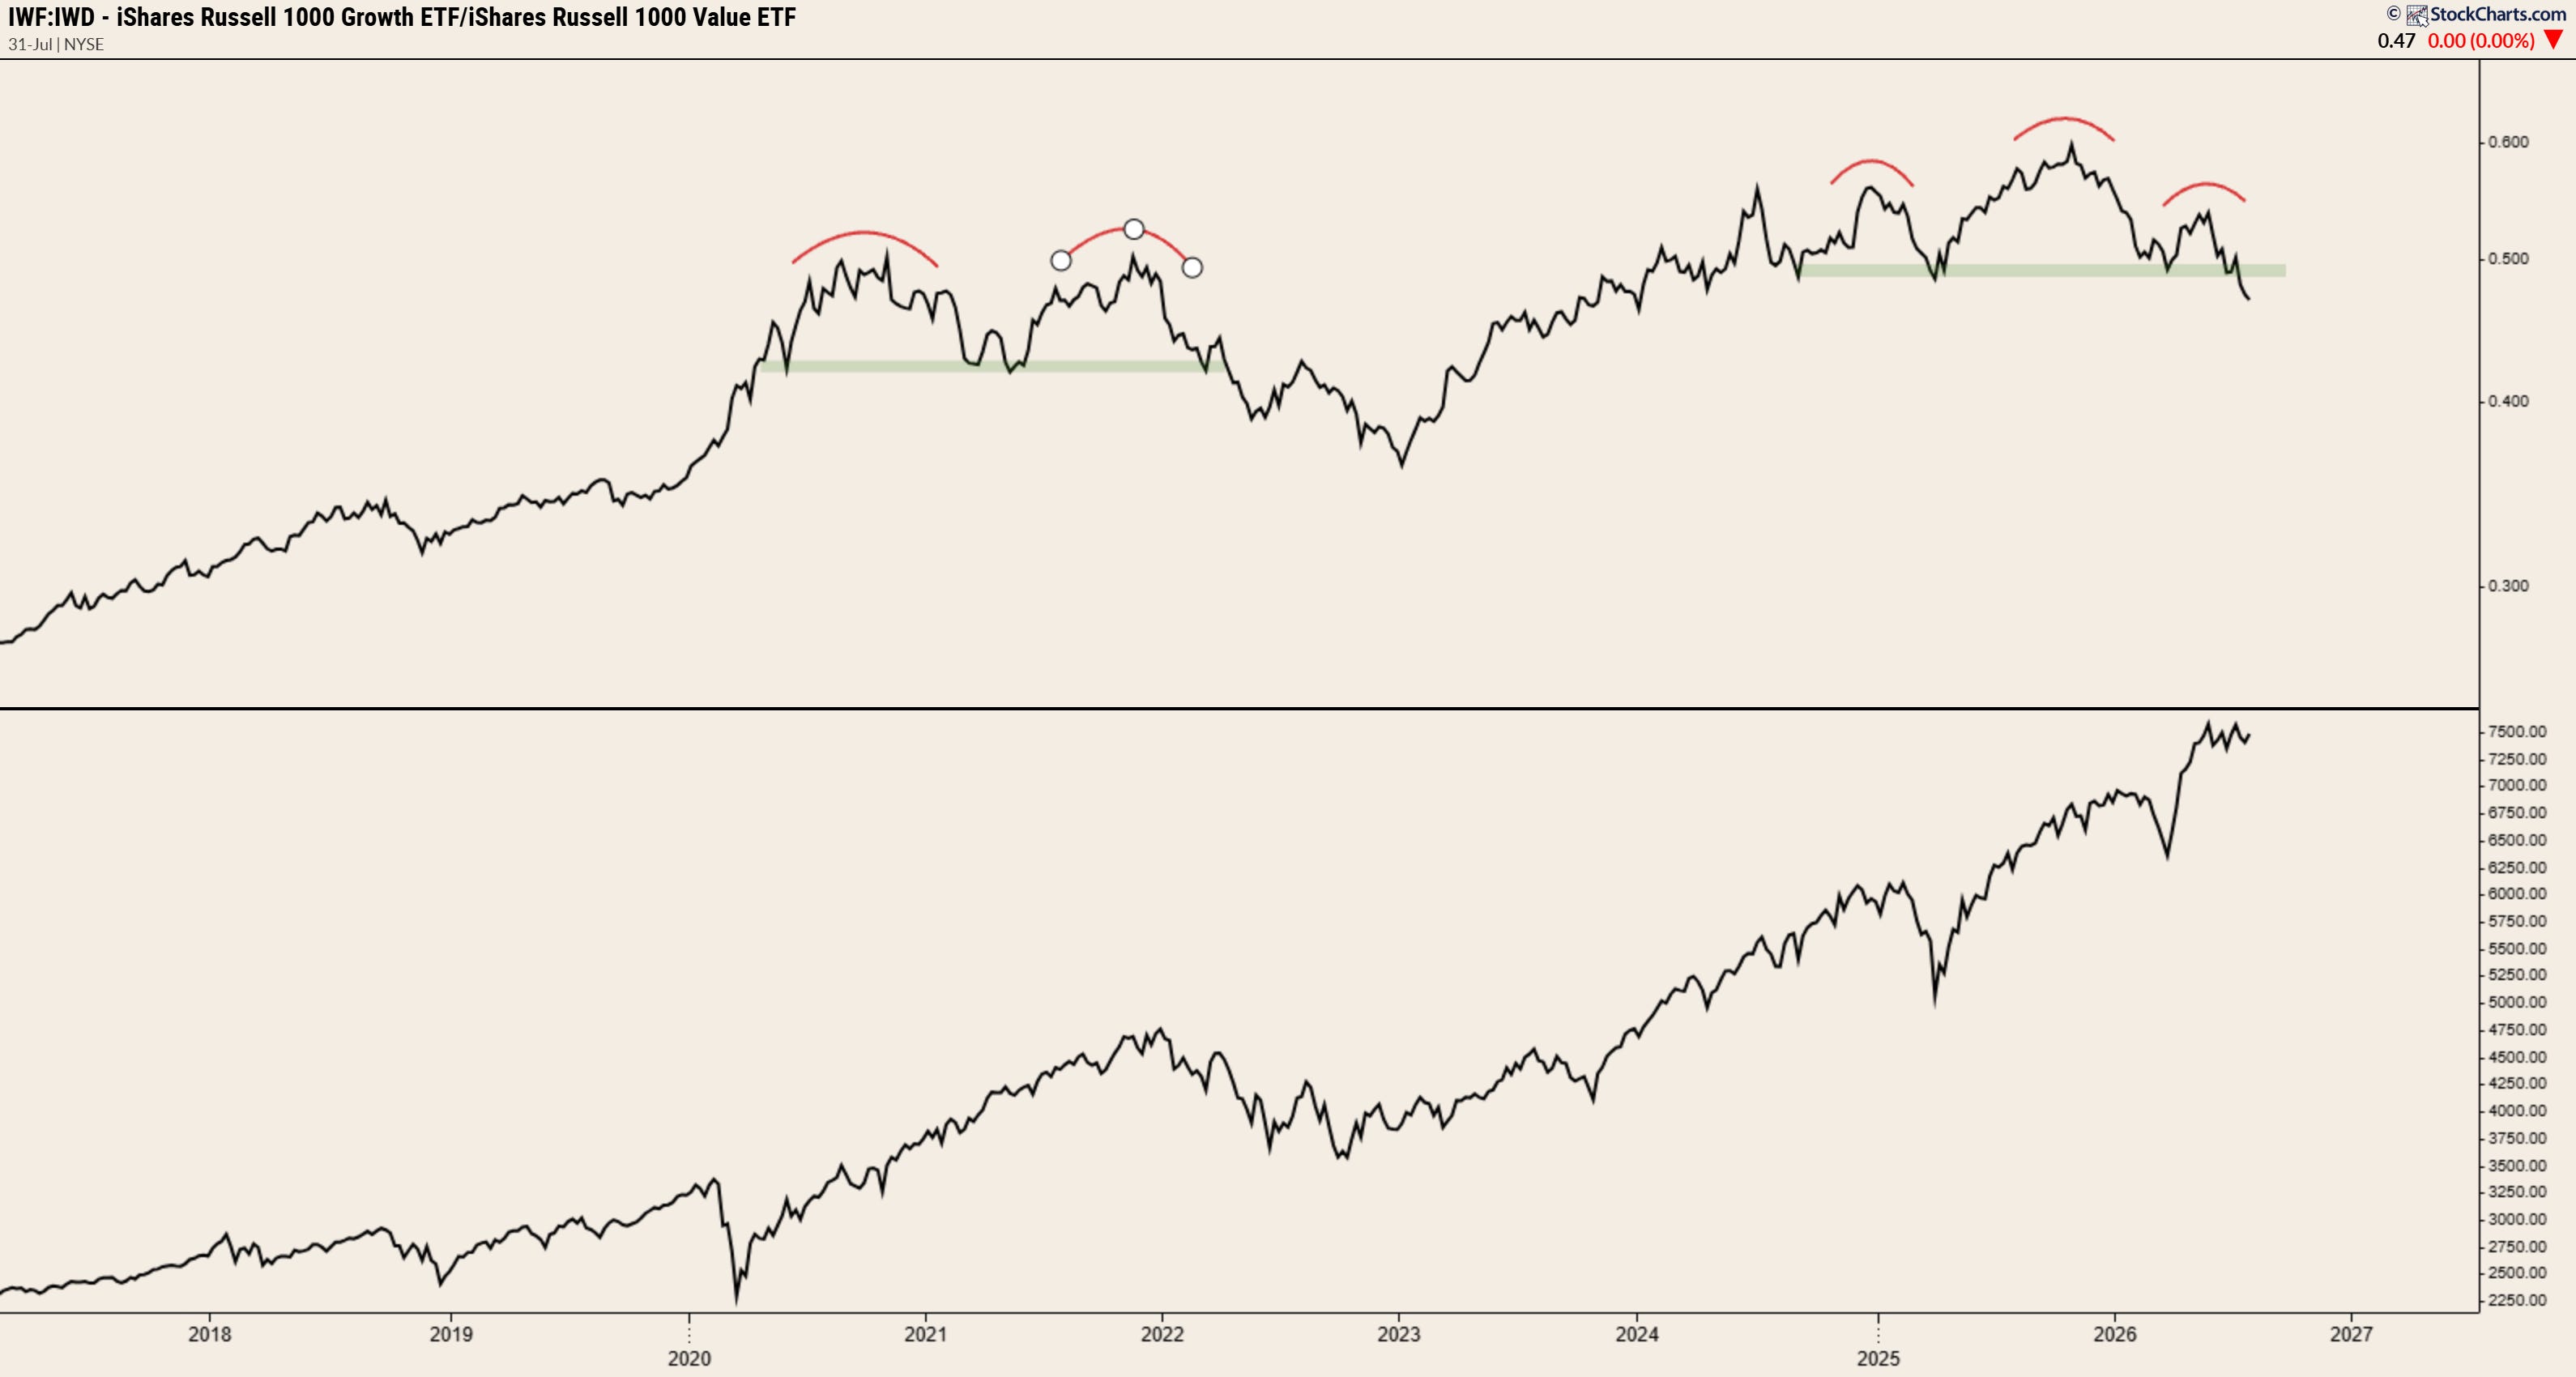
First of, there’s the shift between growth and value that’s been playing out throughout 2026. Note the breakdown from the potential head and shoulders top, with price currently sitting at the lowest level since late 2024.
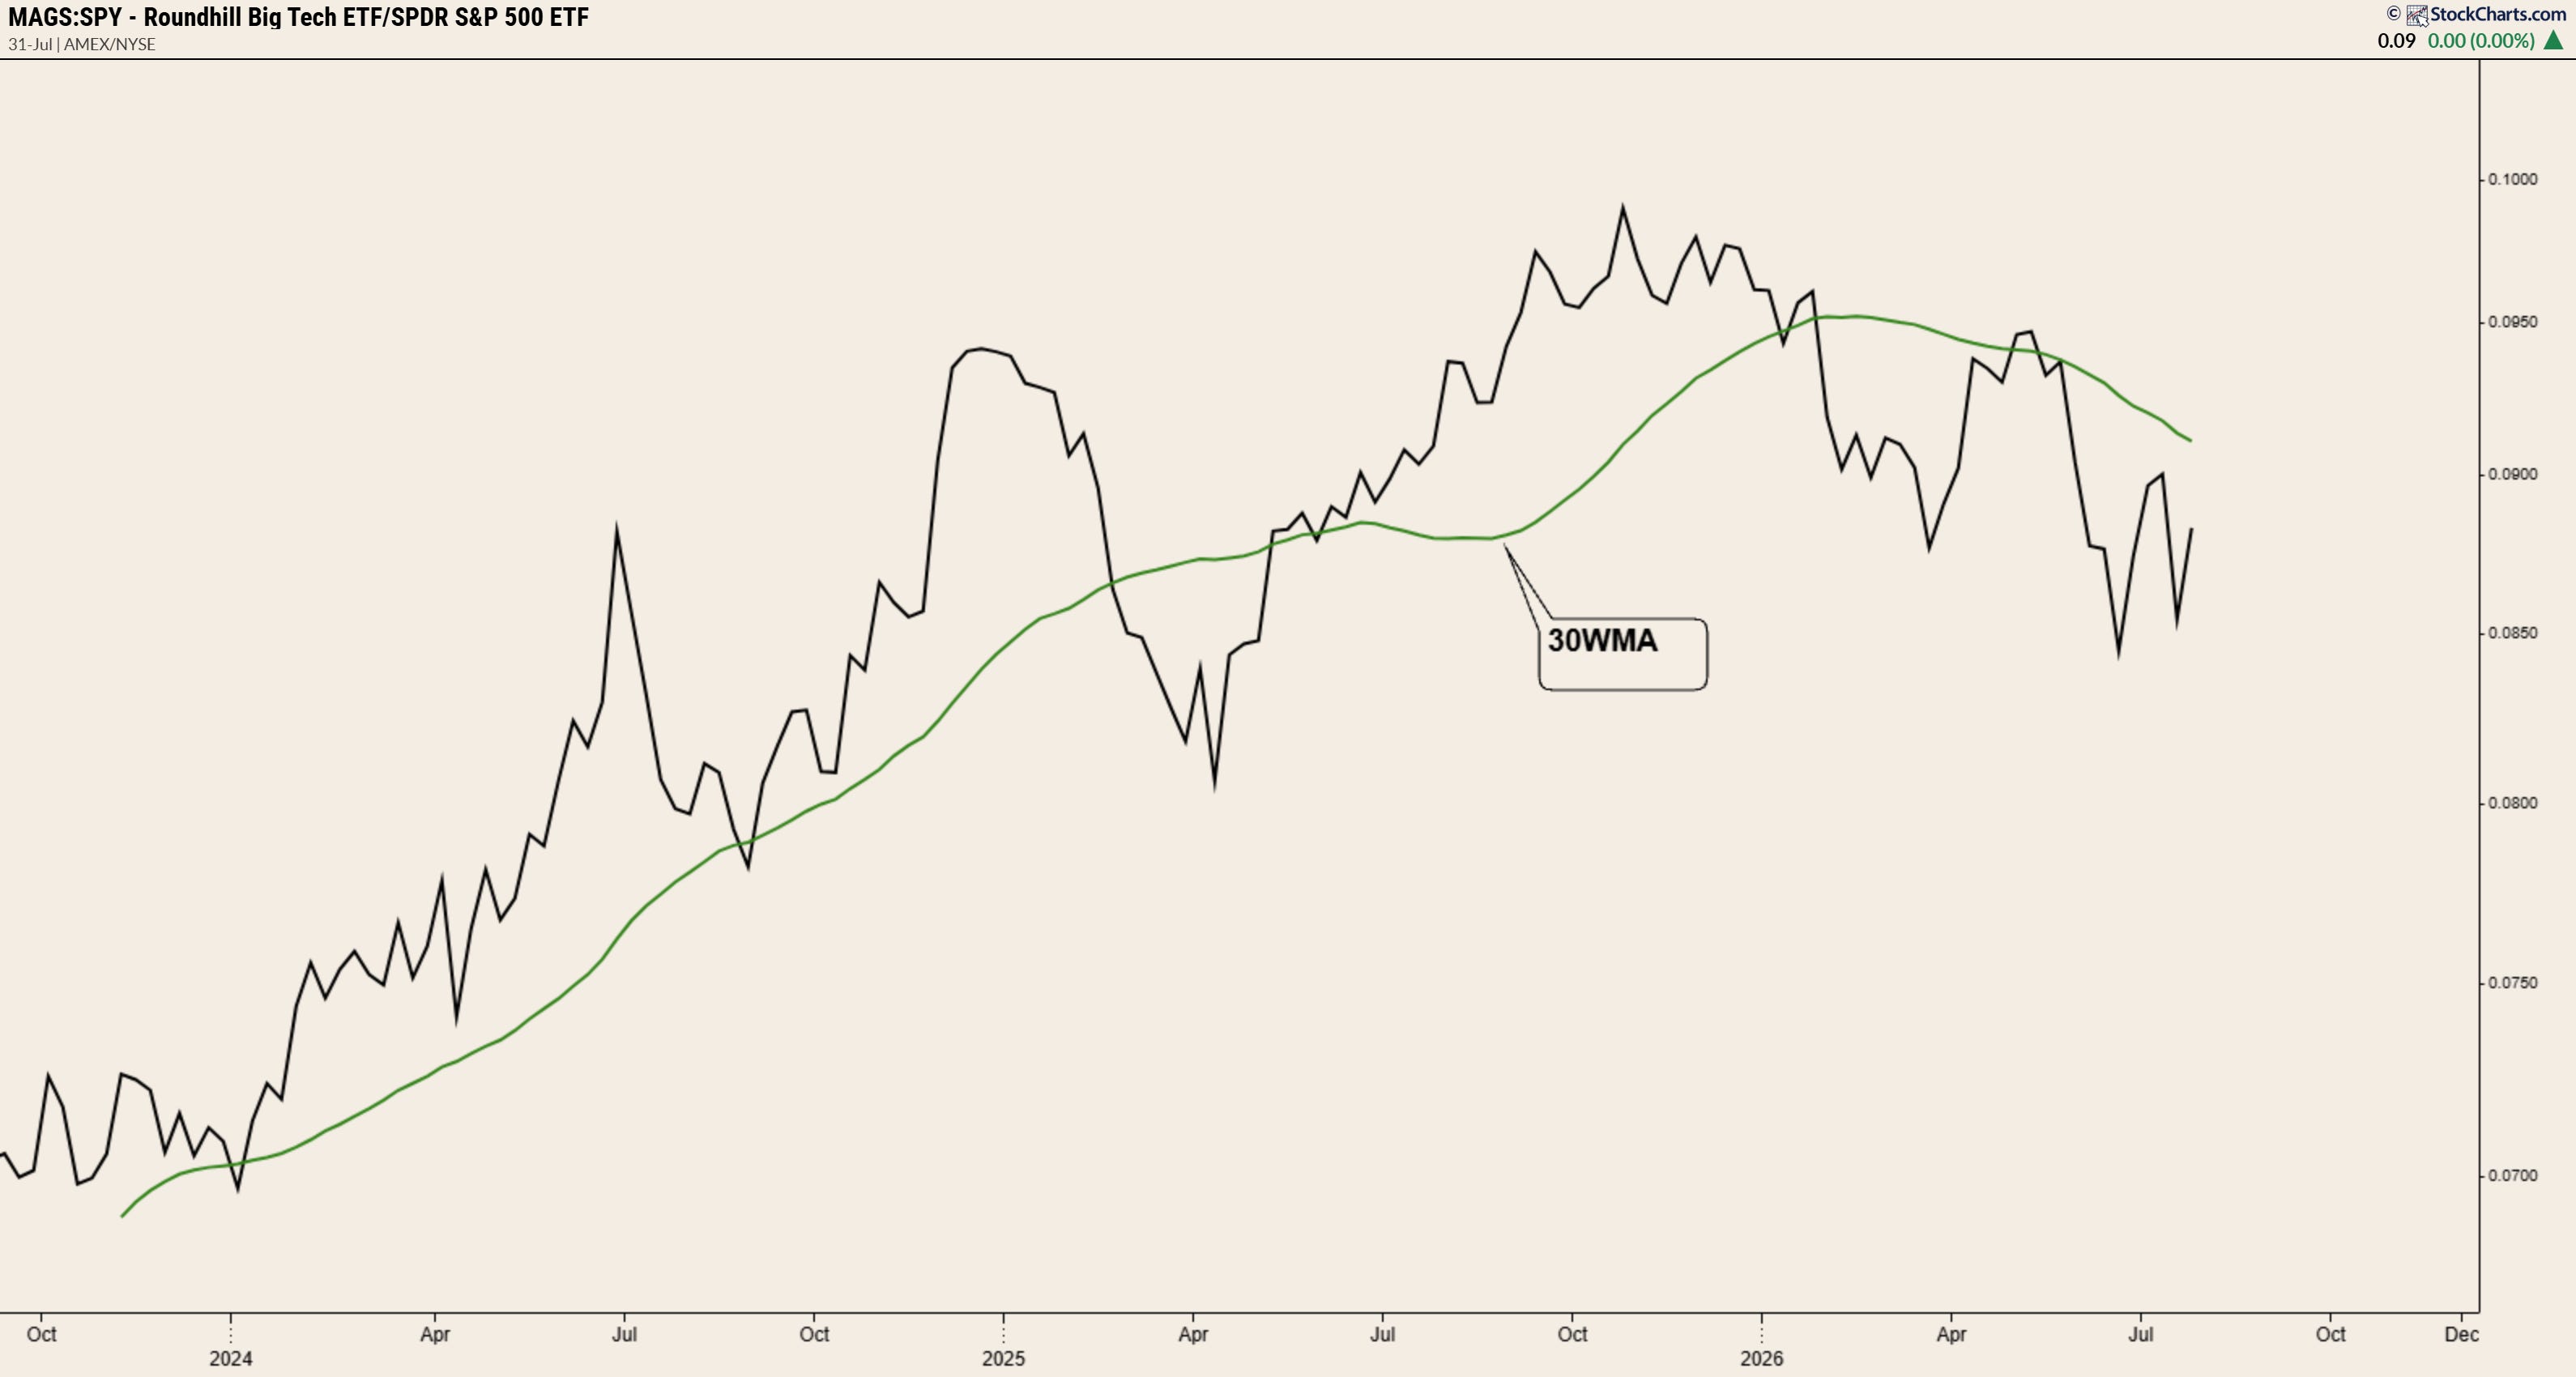
Then there’s the performance of the market’s MVPs MAGS relative to SPY. Note the breakdown below the 30wma which occurred in Q1 of this year and how that same level has flipped from prior support to new resistance. Note also the downward slope of this key moving average for the first time since the ETF’s inception.
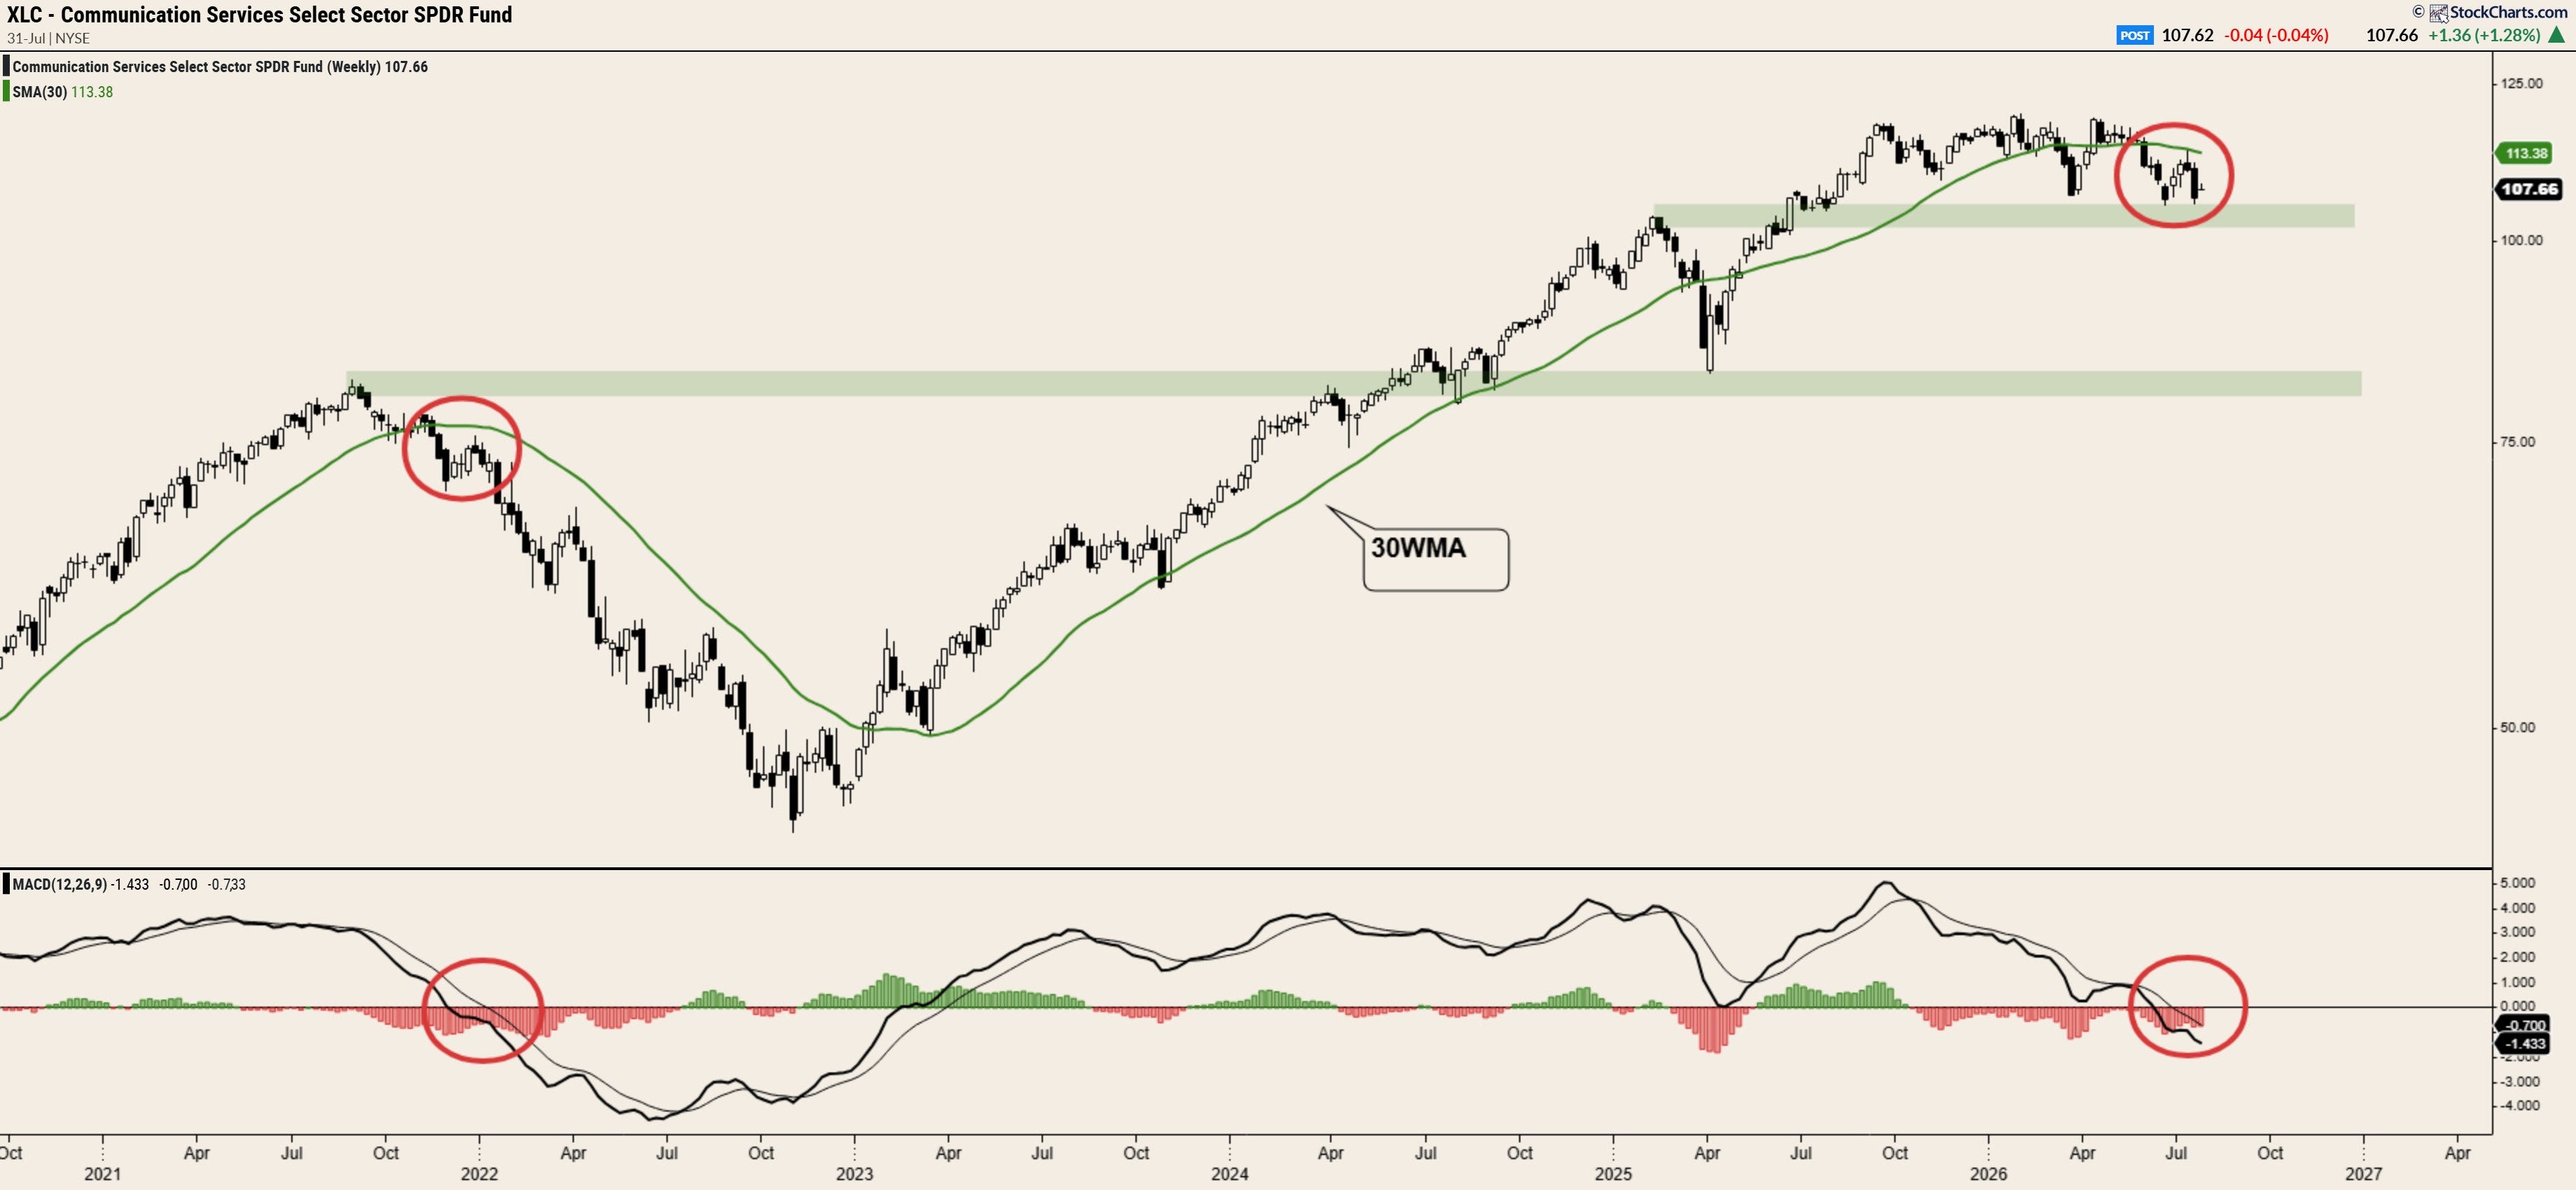
And then there’s XLC which, like MAGS/SPY, has slipped into corrective territory below a declining 30WMA for the first time since the beginning of the 2021 bear.
Bullish Clues…
So far, so confusing. But fear not…
When it comes to assessing the underlying health of the market and where the next opportunity potentially lies, there are a number of tickers I refer back to when periods of chop/uncertainty arise.
Top of that list is NVDA.
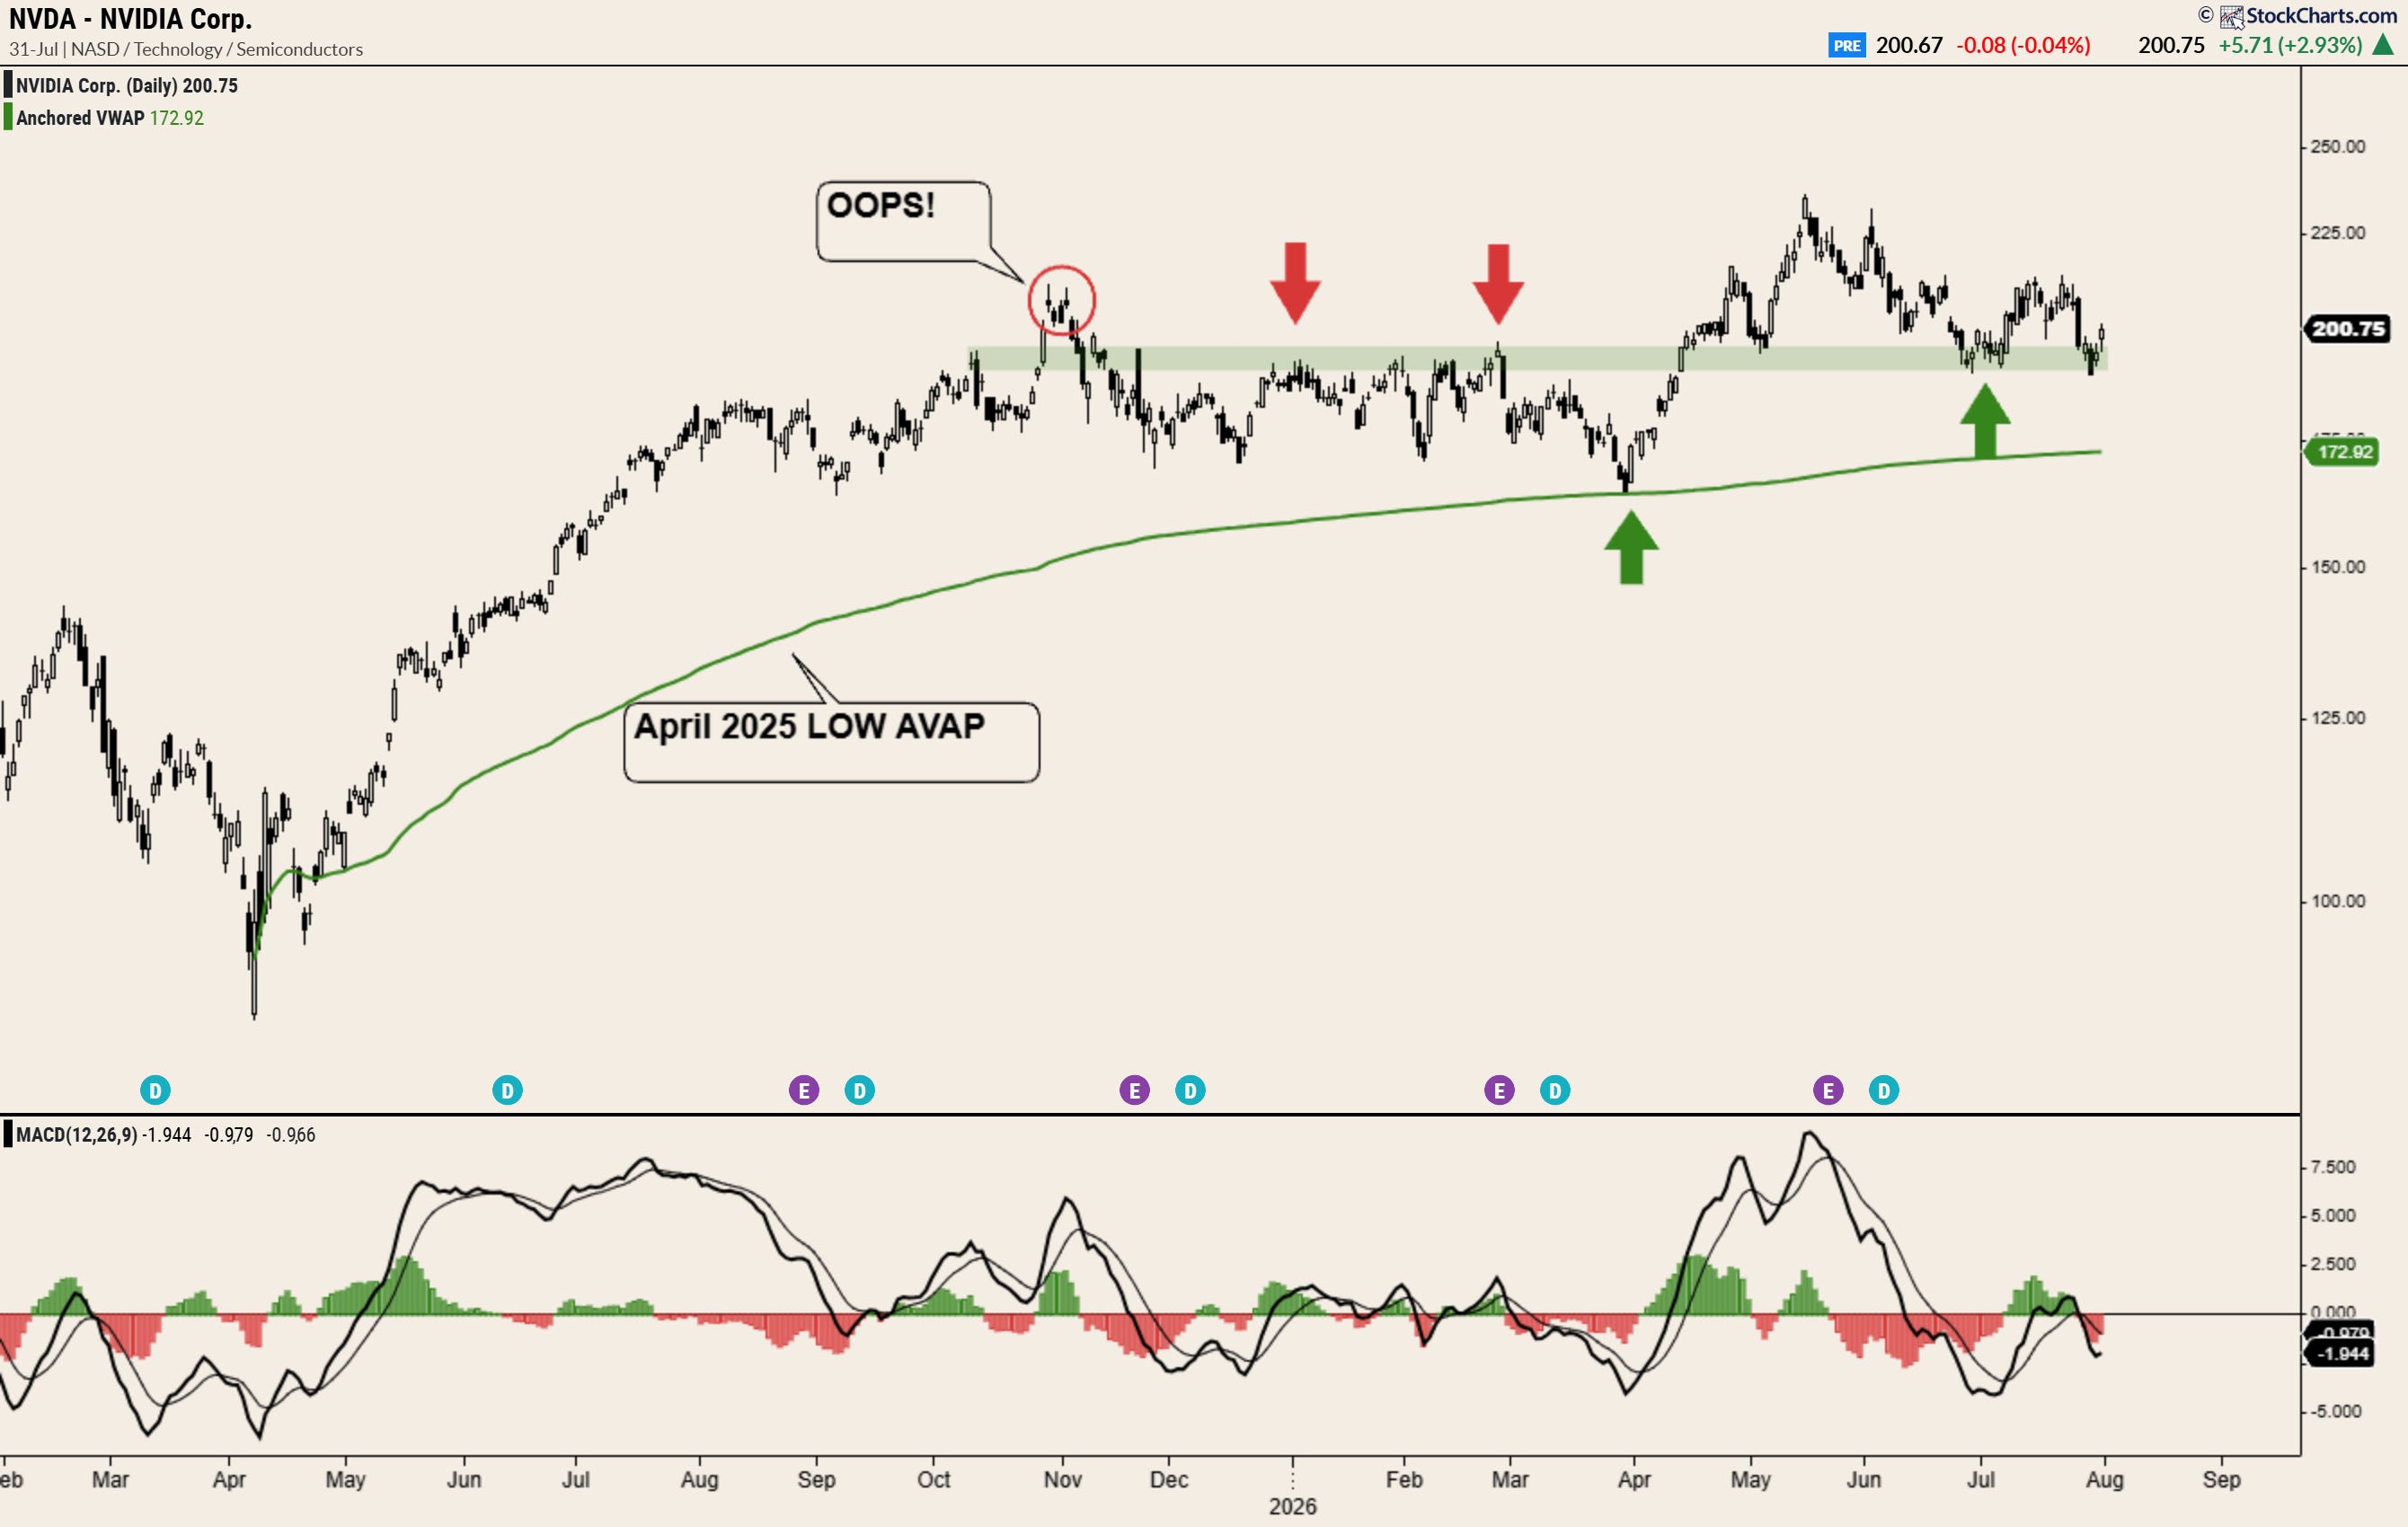
Right now, we're seeing this bellwether hold above a key pivot, comfortably above the AVWAP anchored to the 2025 tariff-tantrum lows. If it can continue to defend the $190 level, I believe that would be one of the clearest signals yet that the AI trade is alive and well - potentially marking the start of a rotation back towards growth over value.
And For the Bears…
On the flip side, XLE is what I’m monitoring as a potential headwind, with the potential to drag indices, growth stocks and broader risk-on measures lower.
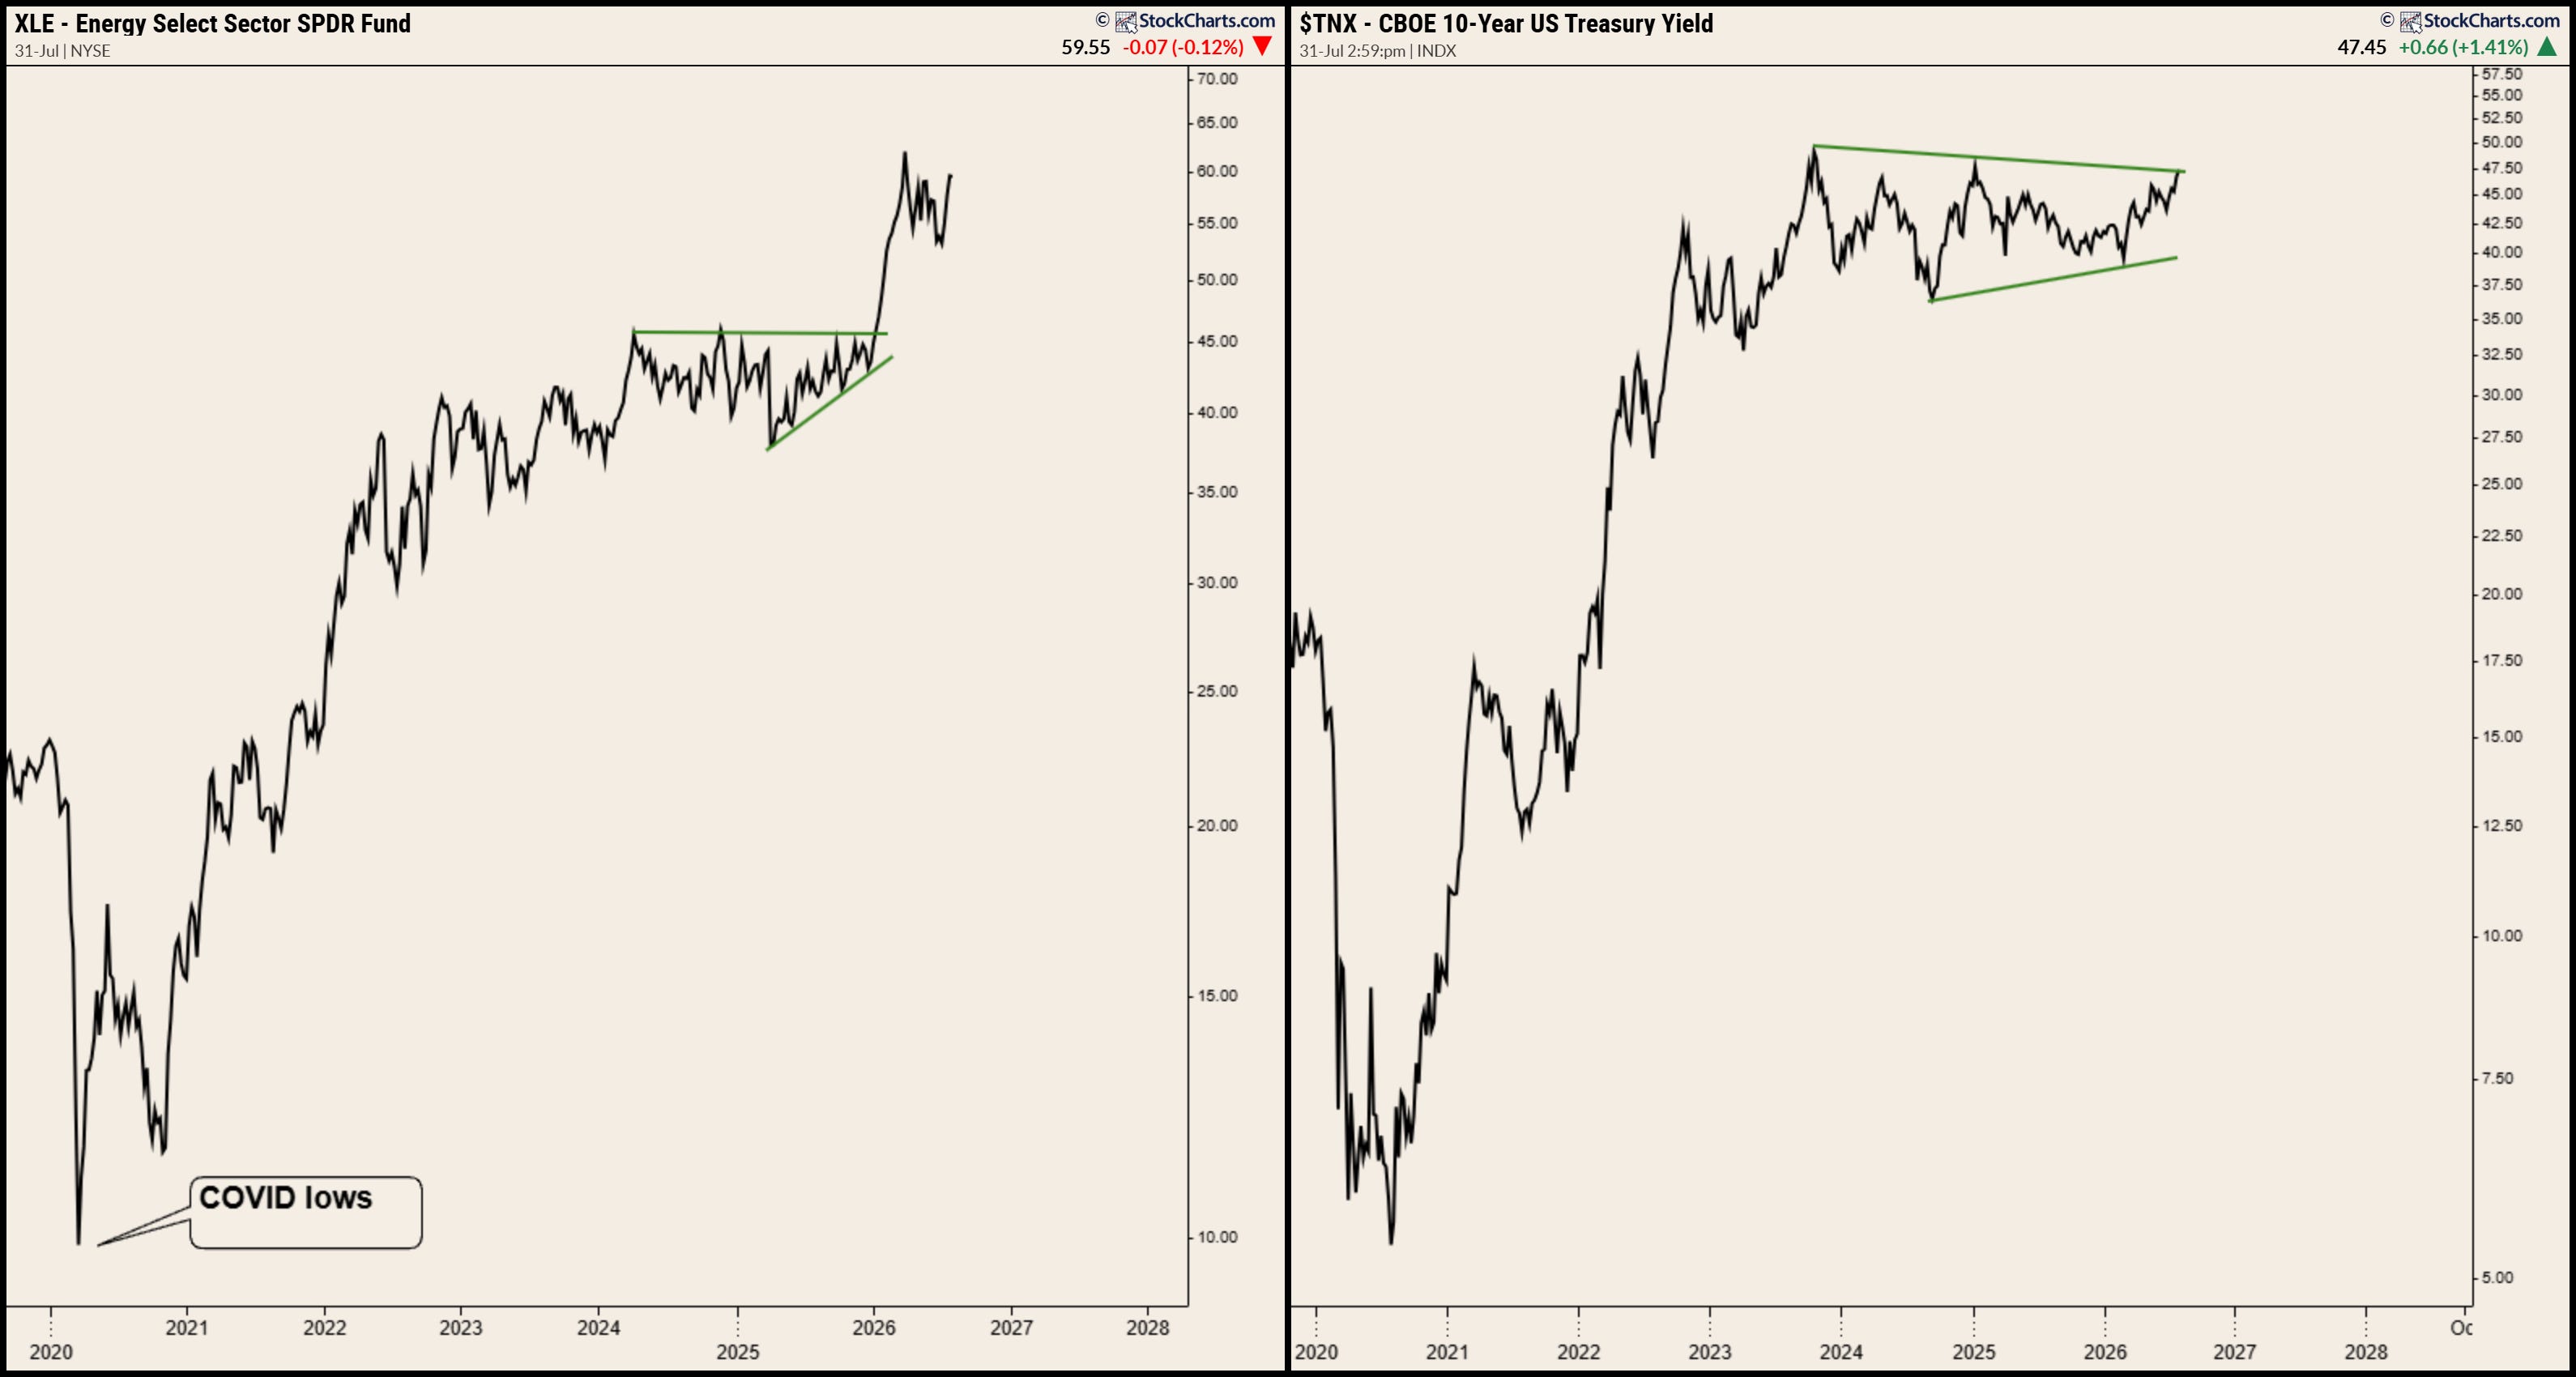
What I’m seeing here is a market that’s beginning to price in a world of higher-for-longer interest rates. Energy has broken decisively above a multi-year base, while the 10-year Treasury yield is once again pressing against the top of a two-year consolidation.
That combination shouldn’t be ignored.
Rising yields increase the discount rate applied to future earnings, disproportionately weighing on the long-duration growth stocks that have led this bull market.
At the same time, persistent strength in energy suggests investors aren’t yet convinced inflation has been fully tamed. If oil continues to climb, it only adds fuel to that narrative.
My Two Cents
Although much of the market remains firmly in the bullish camp - arguably rightly so given the charts I shared at the top of this post - I’m finding myself becoming increasingly cautious at current levels.
If we’re looking to XLE and its relationship with yields for clues, I think it’d be irresponsible to ignore what’s unfolding geopolitically.
The point is fairly straightforward: so long as the Strait of Hormuz remains disrupted, I struggle to build a convincing bearish case for energy.
Any prolonged interruption to one of the world’s most important oil shipping routes has the potential to keep commodity prices elevated, feeding through into higher energy prices and, ultimately, stronger earnings prospects for the likes of XOM, CVX and the broader energy complex.
That doesn’t automatically mean the wider bull market is over. But it does mean there’s a macro backdrop developing that is far less supportive of the high-duration growth stocks that have led this rally. Until that changes, I’d rather err on the side of caution than assume the path of least resistance remains higher.
Of course, the beauty of technical analysis is that it doesn’t demand conviction, but flexibility. If the evidence changes, so will my positioning.
A sustained reclaim of the 30-week moving average in MAGS/SPY would be a meaningful step towards restoring confidence in mega-cap leadership. Likewise, if growth versus value can regain its own long-term trend, I’d have little issue rotating back into the names that have served investors so well over the past three years.
But until those signals appear, I’m reluctant to fight what the market is currently telling me.
Best,
Alex
Disclaimer: The views expressed above are my own and are intended solely for educational and informational purposes. Nothing in this newsletter should be construed as financial advice, a recommendation to buy or sell any security, or a solicitation to take any particular investment action. I may hold positions in securities mentioned and may change those positions without notice. Markets are inherently uncertain, and all investing involves risk, including the potential loss of capital. Always carry out your own research and, where appropriate, seek independent financial advice before making any investment decisions.