
Where are we?
Risk on to risk off, in one simple chart


In the movie Interstellar, the opening scenes signify the mundane and routine — with the film’s main character, Cooper, undertaking school runs and harvests - all with a quiet confidence that tomorrow would mirror today.
Then, almost imperceptibly, something shifts. And suddenly, the mission changes from maintaining life as we know it… to finding a way to survive.
In market terms, last month saw a similar - albeit milder - shift. Moving from the ‘risk on rally’ that had the easy rhythm of the film’s opening scenes, to the potential beginnings of something a little less steady.
Are we in ‘risk off’ mode presently? Not quite.
But where last week I was bulled up and happy holding winners on Amazon, Coinbase and PayPal, this week I’m scaling back and preserving my stack.
Why? I hear you ask.
Because where Cooper had instruments to guide him through space, I have charts.
Sure, my cockpit’s a little different. The hum of the ship replaced by the glow of a screen, the horizon by a sea of charts. But the principle’s the same: trusting what’s in front of you.
Whether it’s breadth, volatility, or credit spreads, each gauge tells me something about the atmosphere we’re flying through.
And right now, those dials are twitching — suggesting potential turbulence ahead.
When it comes to identifying the environment we’re in, there’s a ton of literature available for newbies like myself. From Elliott Waves to candlestick patterns, you could literally spend weeks trying to wrap your head around every possible framework for interpreting the market.
But at some point, you realise all these tools — from waves to ratios to oscillators — provide more noise than actionable insights. And instead of telling you what’s coming next, they identify where you’ve been. And that, in itself, is invaluable.
What’s critical is understanding where we are - because if you know this, you can adapt. Choosing whether to throttle up or pullback, based on the weight of evidence that’s in front of you at any given moment.
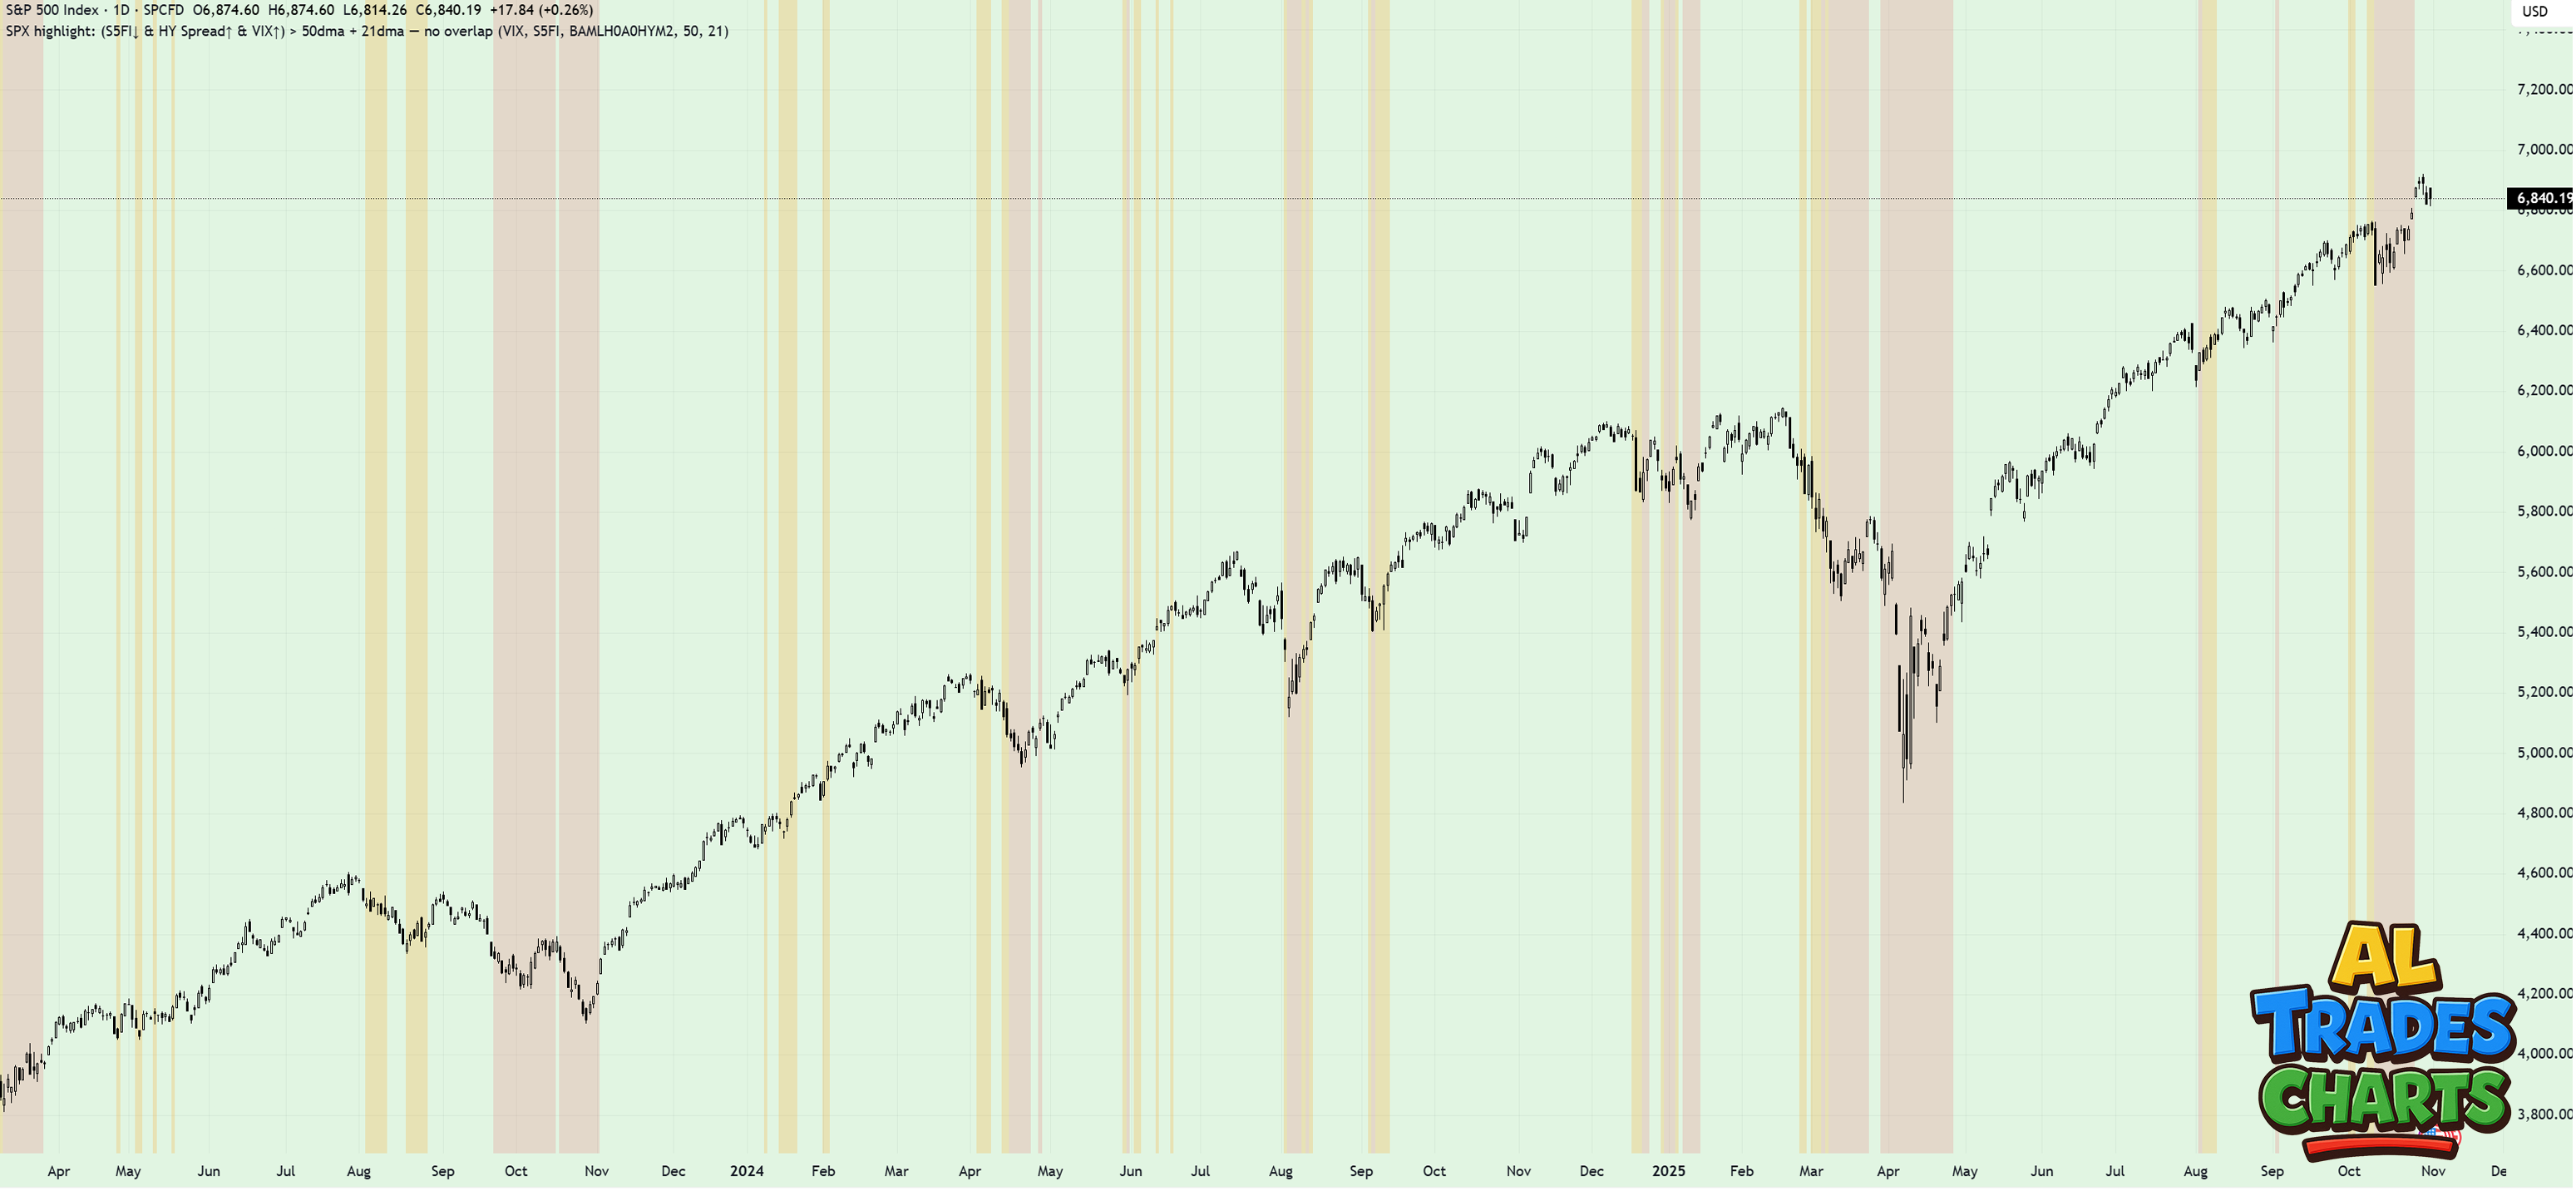
How I do this is through a custom indicator I built on Trading View, using Pine Editor and AI. What this shows isn’t complicated, in fact it only uses three metrics to help identify the environment we’re in:
VIX > 50dma
Credit spreads > 50dma
% of SPX stocks above their 50dma < 50dma
When all three occur simultaneously, a red shaded area will appear on the chart.
(For those wondering what the orange bars represent, those are similar instances but using the 21dma instead of the 50dma - these can be seen as more of a ‘warning zone’, rather than a full ‘risk off’ indicator.)
What this shows is that when SPX is sitting in the red zone, stocks tend to fall - which is to be expected when breadth is weak, volatility is high and credit spreads are widening - all at the same time.
This played out consistently throughout the April shakeout, the unwinding of the Yen carry trade in 2024 and the 2021 bear market - proving itself to be a useful indicator in real time.
Right now, you’ll notice that we’re just emerging from a red zone which coincided with last month’s 3% drop, suggesting that the latest ‘shock’ is over.
But here’s why I’m reluctant to add too many longs, just yet:
The VIX refuses to hold below its 50dma
Breadth remains weak, with the % of SPX stocks above their 50dma sliding to multi-month lows in October
Credit spreads, which although low by historic standards, are rising - currently only a few bps below the 50dma
Should these risks subside over the coming days and weeks, I won’t hesitate to reengage with the bull market and add some long positions to my portfolio. That’s what traders do - we adapt.
But I’m not there yet - I want to see more evidence that my ‘under the hood’ metrics are moving in the right direction. Why?
Just take a look at what happened in early April this year - the red zone ended, only for another one to emerge a few days later, wiping out those that rushed in before stocks had bottomed.
And that’s the thing about turbulence, it doesn’t always announce itself.
Sometimes, the instruments flicker, the readings go quiet, and for a moment, you think you’re through it. Then comes the next pocket of air.
In Interstellar, Cooper didn’t ignore his gauges just because the ride smoothed out — he stayed alert, trusting the data even when his instincts wanted comfort.
That’s where I’m at now.
Not fearful, just focused.
Best,
Alex